Gate Signals#
Aim of the tutorial#
In this tutorial, the digital voltage adapter board is used to generate a PWM signal at D1. You can use a scope to measure the gate signal. An assertion is triggered to showcase its use.
After this tutorial, you can:
Use the PWM-module
Test the optical adapter board
Requirements#
The following tutorial requires:
Digital voltage card in slot D1.
Some sort of oscilloscope
Guideline#
We will use the three-phase wave from the previous tutorial to give out gate signals on the digital voltage card.
In your custom if-statement in the isr.c assign the three
Global_Data.rasv.halfBridgeXDutyCyclevariables the values from thethree_phase_outputstruct.Add an else-if-statement to your if-statement which sets all three
Global_Data.rasv.halfBridgeXDutyCycleto0.0fagain. The else-if-statement should trigger, if either thecurrent_stateis not in thecontrol_stateor theis_three_phase_activevalue isfalse.This is done to reset the DutyCycles and prevents those variables from still carrying a value unequal to zero after the Control State has been left.
This way, activating the Running state will not output the latest value from the
three_phase_outputstruct, but instead it will output 0 to the gates.
Set the initial value of the variables
amplitude,frequencyandoffsetto1.0f,1.0fand0.5frespectively.1 //.... 2 float amplitude = 1.0f; 3 float frequency = 1.0f; 4 float offset = 0.5f; 5 //.... 6 if (current_state==control_state) 7 { 8 if (is_three_phase_active) { 9 three_phase_output = uz_wavegen_three_phase_sample(amplitude, frequency, offset); 10 Global_Data.rasv.halfBridge1DutyCycle = three_phase_output.a; 11 Global_Data.rasv.halfBridge2DutyCycle = three_phase_output.b; 12 Global_Data.rasv.halfBridge3DutyCycle = three_phase_output.c; 13 } 14 } else if (current_state!=control_state || !is_three_phase_active) { 15 Global_Data.rasv.halfBridge1DutyCycle = 0.0f; 16 Global_Data.rasv.halfBridge2DutyCycle = 0.0f; 17 Global_Data.rasv.halfBridge3DutyCycle = 0.0f; 18 } 19 uz_PWM_SS_2L_set_duty_cycle(Global_Data.objects.pwm_d1, Global_Data.rasv.halfBridge1DutyCycle, Global_Data.rasv.halfBridge2DutyCycle, Global_Data.rasv.halfBridge3DutyCycle); 20 //....
Build the changes and flash the UltraZohm.
Switch to the Debug-View in Vitis, select the Vitis-Serial-Terminal, click on the green +-Symbol and connect the serial port to the USB-port with which your JTAG-cabel is connected to the computer.
This connects the Vitis serial port with the UltraZohm.
This way, messages from the UltraZohm can be read in the Vitis-Serial-Terminal.
On Windows, the Port may be called COM6.
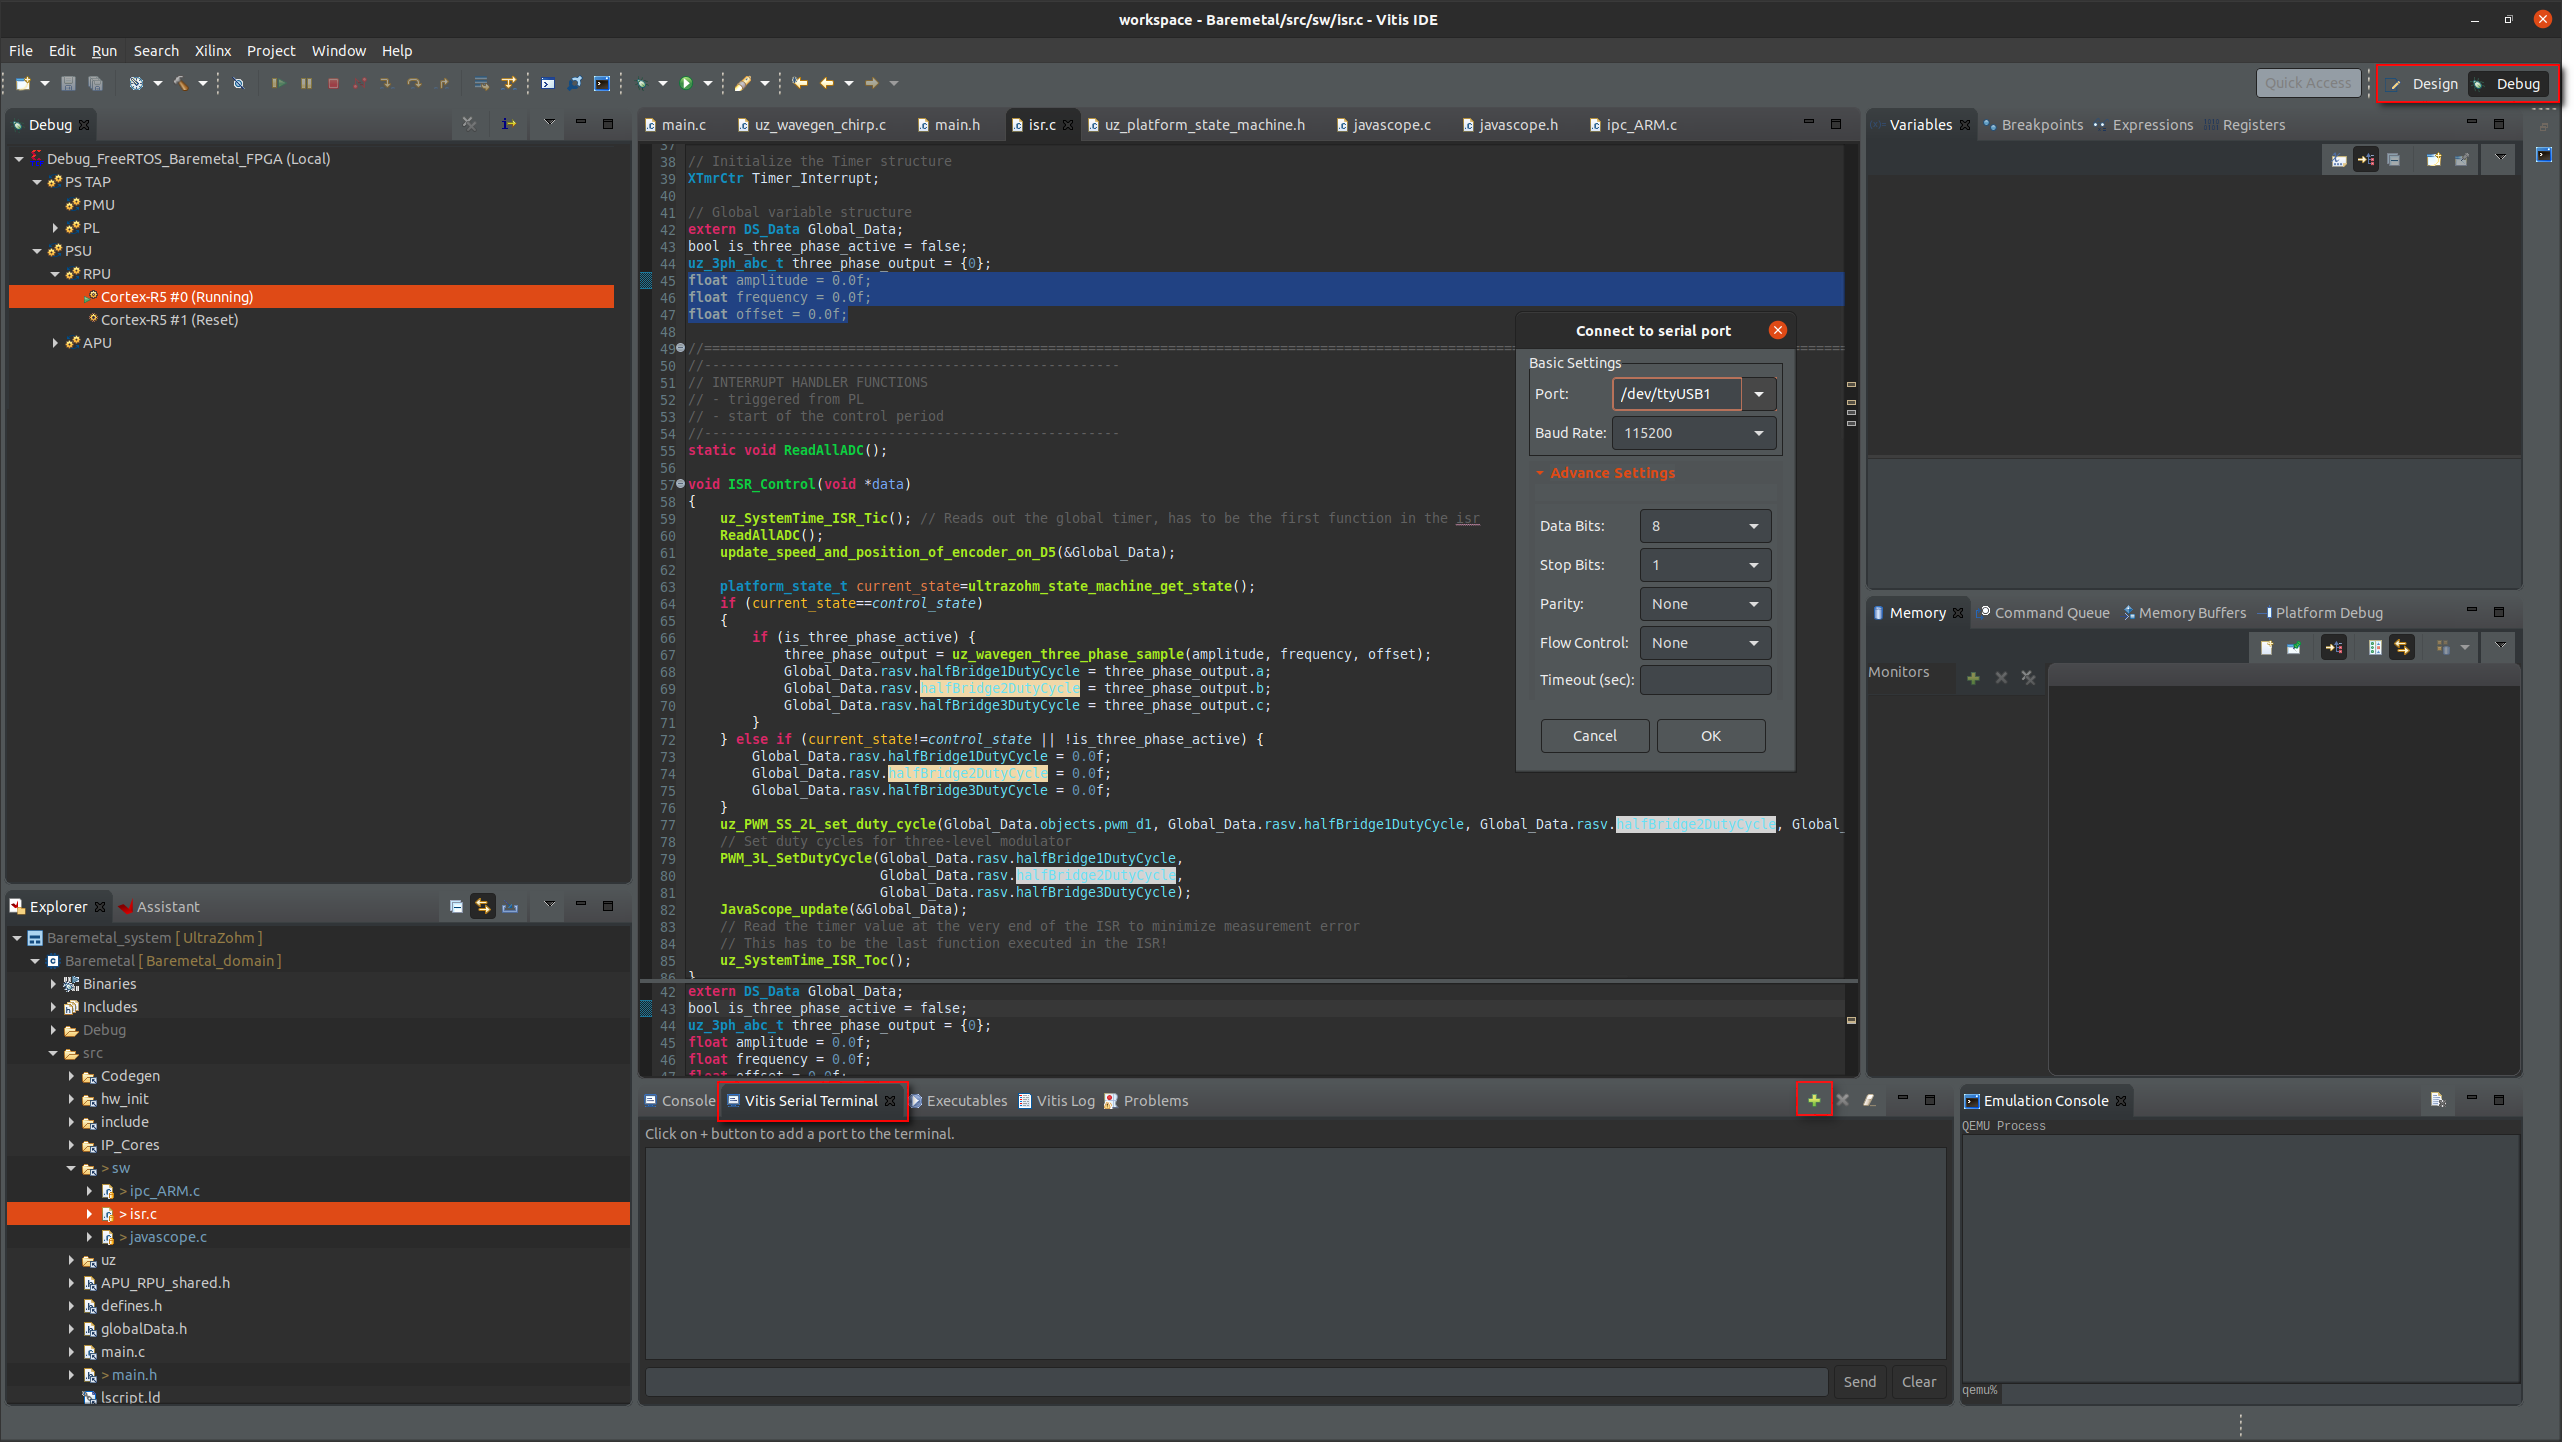
Fig. 10 Vitis view to connect serial port.#
Connect the GUI and press the Enable System and Enable Control buttons.
After pressing the
My_Button4, the UltraZohm should switch into its Error State. This happens, because an assertion got triggered. The red Error LED should light up as well.Assertions are used to guarantee that the conditions and limits of a function are met at runtime.
The UltraZohm error handling follows the concept to fail loudly, i.e., all assertions stop the processor and require a power cycle. This means, that if an assertion fires, the UltraZohm is brought into a safe state.
For further information see Assertions.
In the Vitis-Serial-Terminal it should say where the assertion triggered (e.g.
Assertion in file uz_PWM_SS_2L_hw.c on line 13).This message tells you exactly which line in the stated file did trigger the assertion.
This can be used to give you a clue, which settings violated the function parameters.
In our case the assertion got triggered, because the DutyCycles we gave the function
uz_PWM_SS_2L_set_duty_cycleexceeded the value of1.0f.To fix this, set the initial value of the
amplitudevariable to0.5f.Build the workspace, flash the UltraZohm and connect the GUI.
Enable the System & Control and activate the three-phase wave by pressing the respective button in the GUI, as done in the previous tutorial.
Open up your oscilloscope and measure the output voltages at the pins of the Digital voltage card with a probe. A different PWM signal with a constantly changing DutyCycle should be visible on the first 6 pins (Pin 1-6 in the layout).
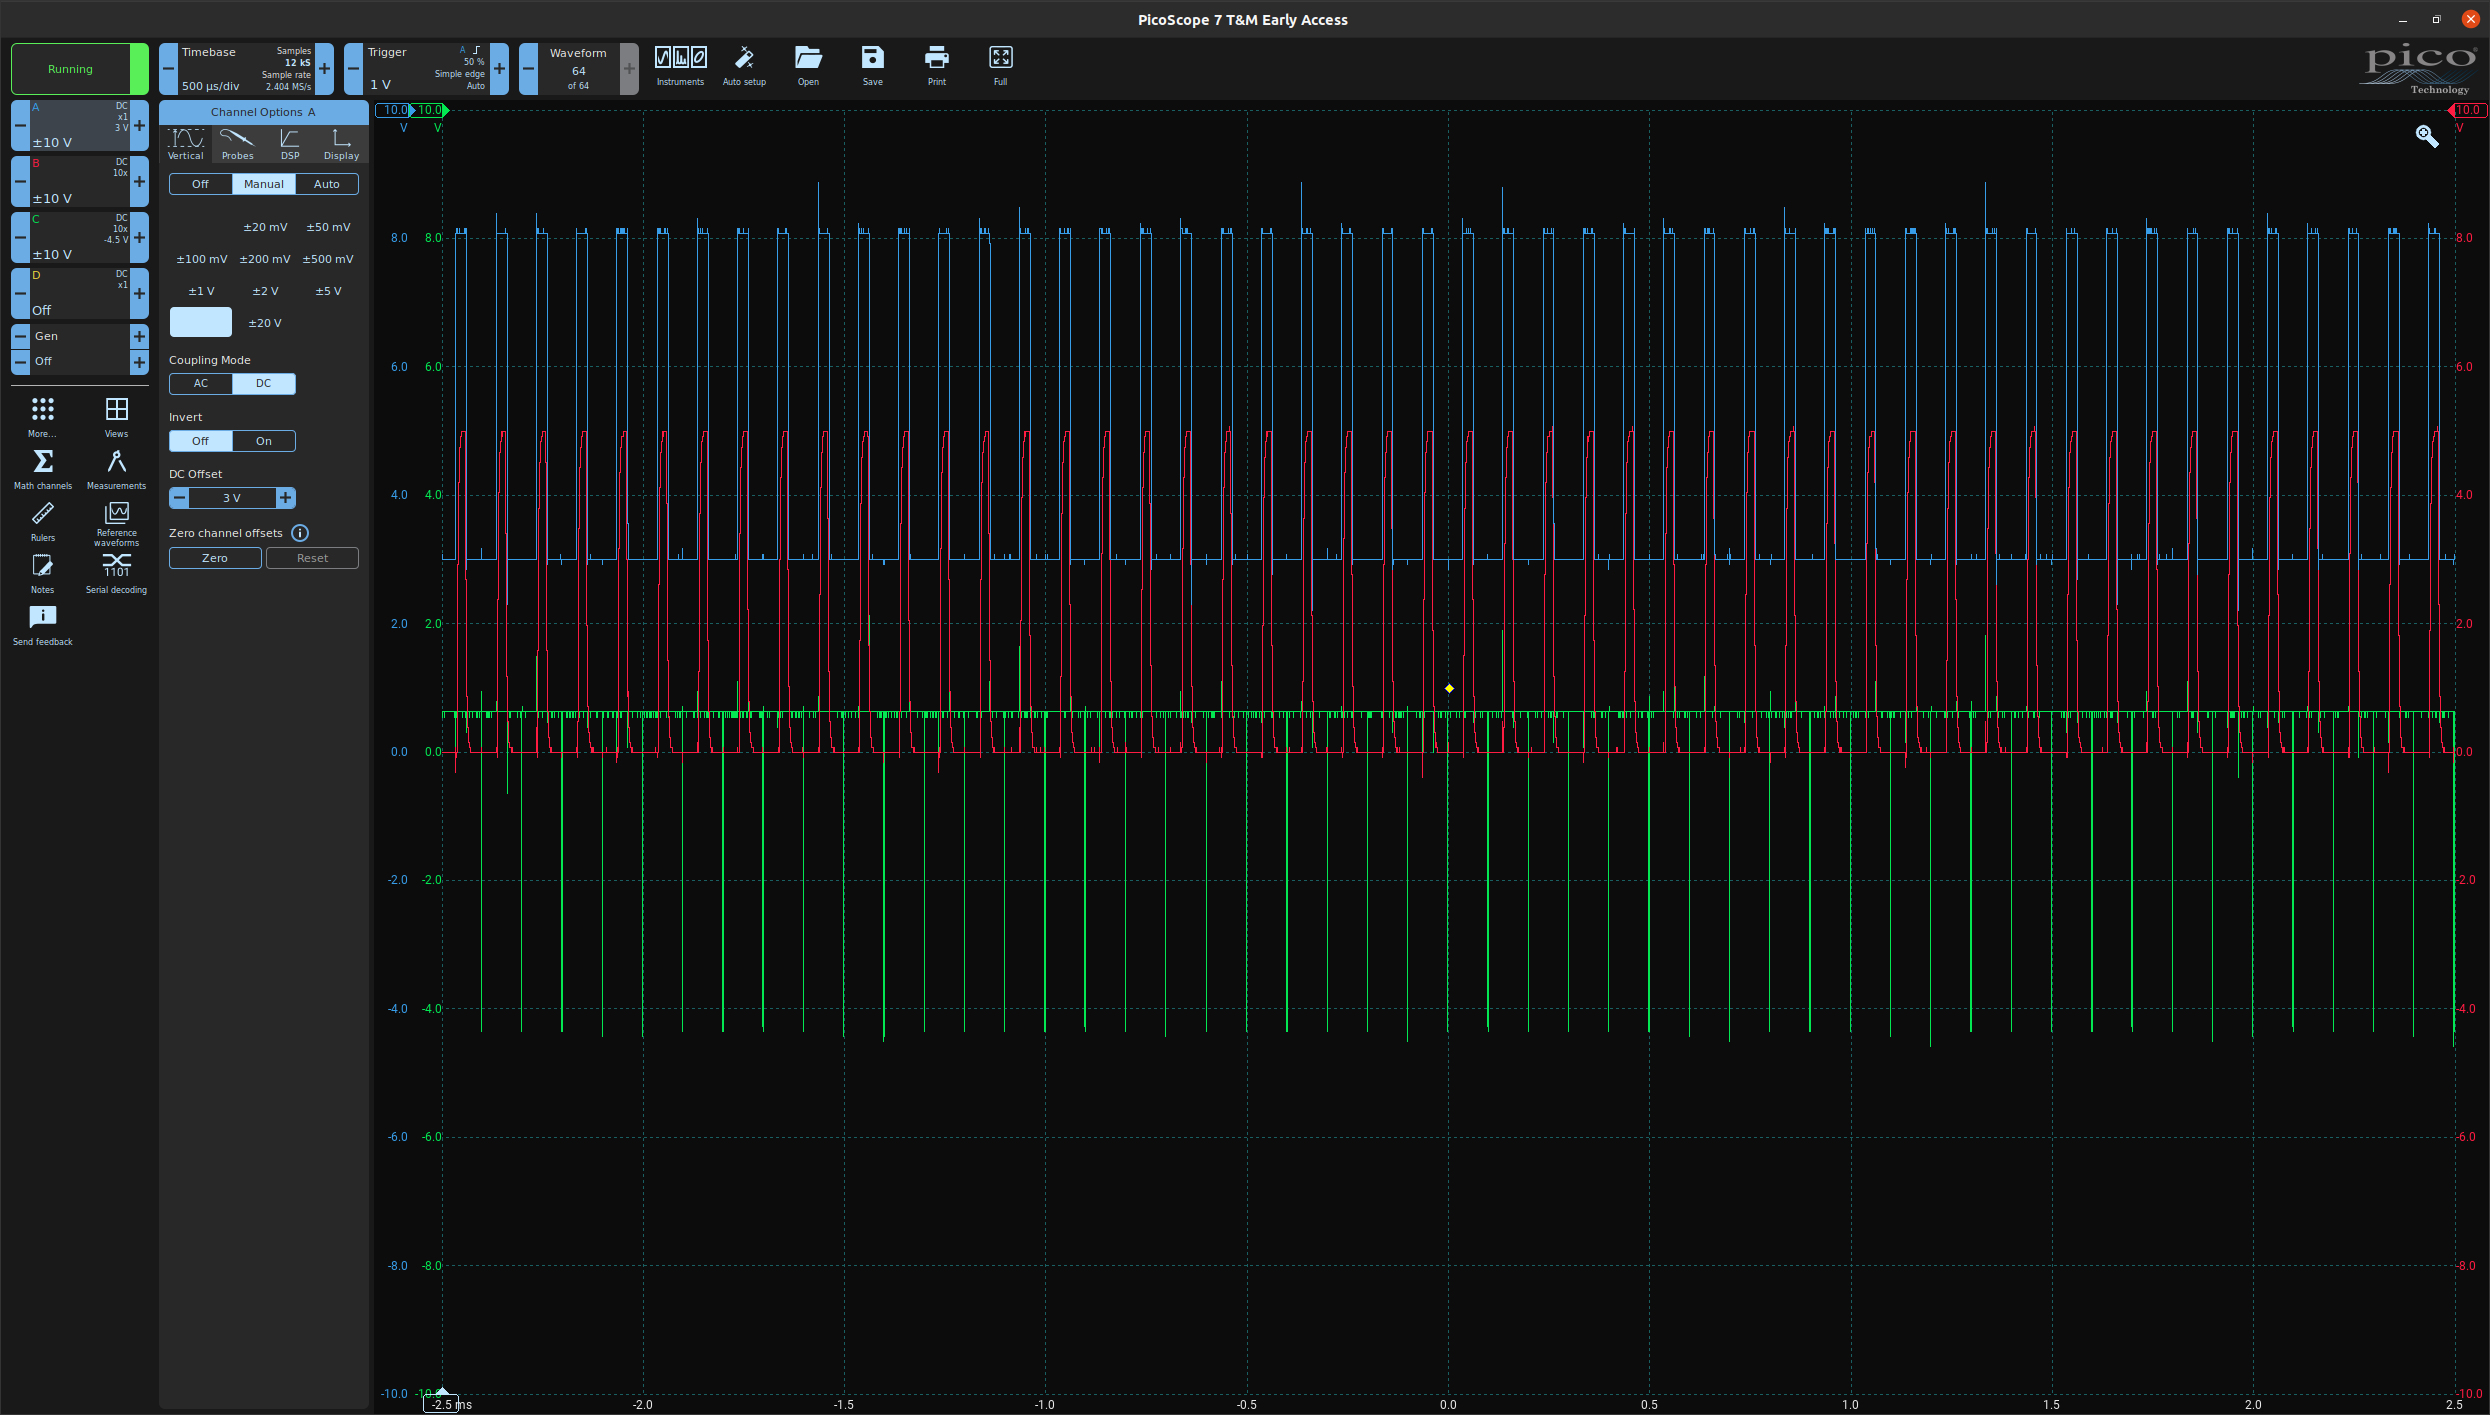
Fig. 11 Visible PWM signals in an oscilloscope.#
Delete the function call
uz_wavegen_three_phase_sampleand the if-statement regardingis_three_phase_active, but keep the assignment of thehalfBridgeXDutyCycle‘s. Adjust the else-if-statement accordingly.1 //.... 2 if (current_state==control_state) 3 { 4 Global_Data.rasv.halfBridge1DutyCycle = three_phase_output.a; 5 Global_Data.rasv.halfBridge2DutyCycle = three_phase_output.b; 6 Global_Data.rasv.halfBridge3DutyCycle = three_phase_output.c; 7 } else { 8 Global_Data.rasv.halfBridge1DutyCycle = 0.0f; 9 Global_Data.rasv.halfBridge2DutyCycle = 0.0f; 10 Global_Data.rasv.halfBridge3DutyCycle = 0.0f; 11 } 12 uz_PWM_SS_2L_set_duty_cycle(Global_Data.objects.pwm_d1, Global_Data.rasv.halfBridge1DutyCycle, Global_Data.rasv.halfBridge2DutyCycle, Global_Data.rasv.halfBridge3DutyCycle); 13 //....
Build and flash the UltraZohm and connect the GUI.
In the Debug view in Vitis go the the expressions tab and add the
three_phase_outputstruct as a new expression.This lets you modify the value of the
three_phase_outputstruct during runtime.Therefore i.e. different values can be sent to or read out from the R5.
Note
Refreshing the the values of the expressions (green box in Fig. 12) stops the processor for a couple of cycles. The more expressions are logged, the longer the stoppage takes.
Select the R5 in the debug view on the left side. The value of the expression should now be visible.
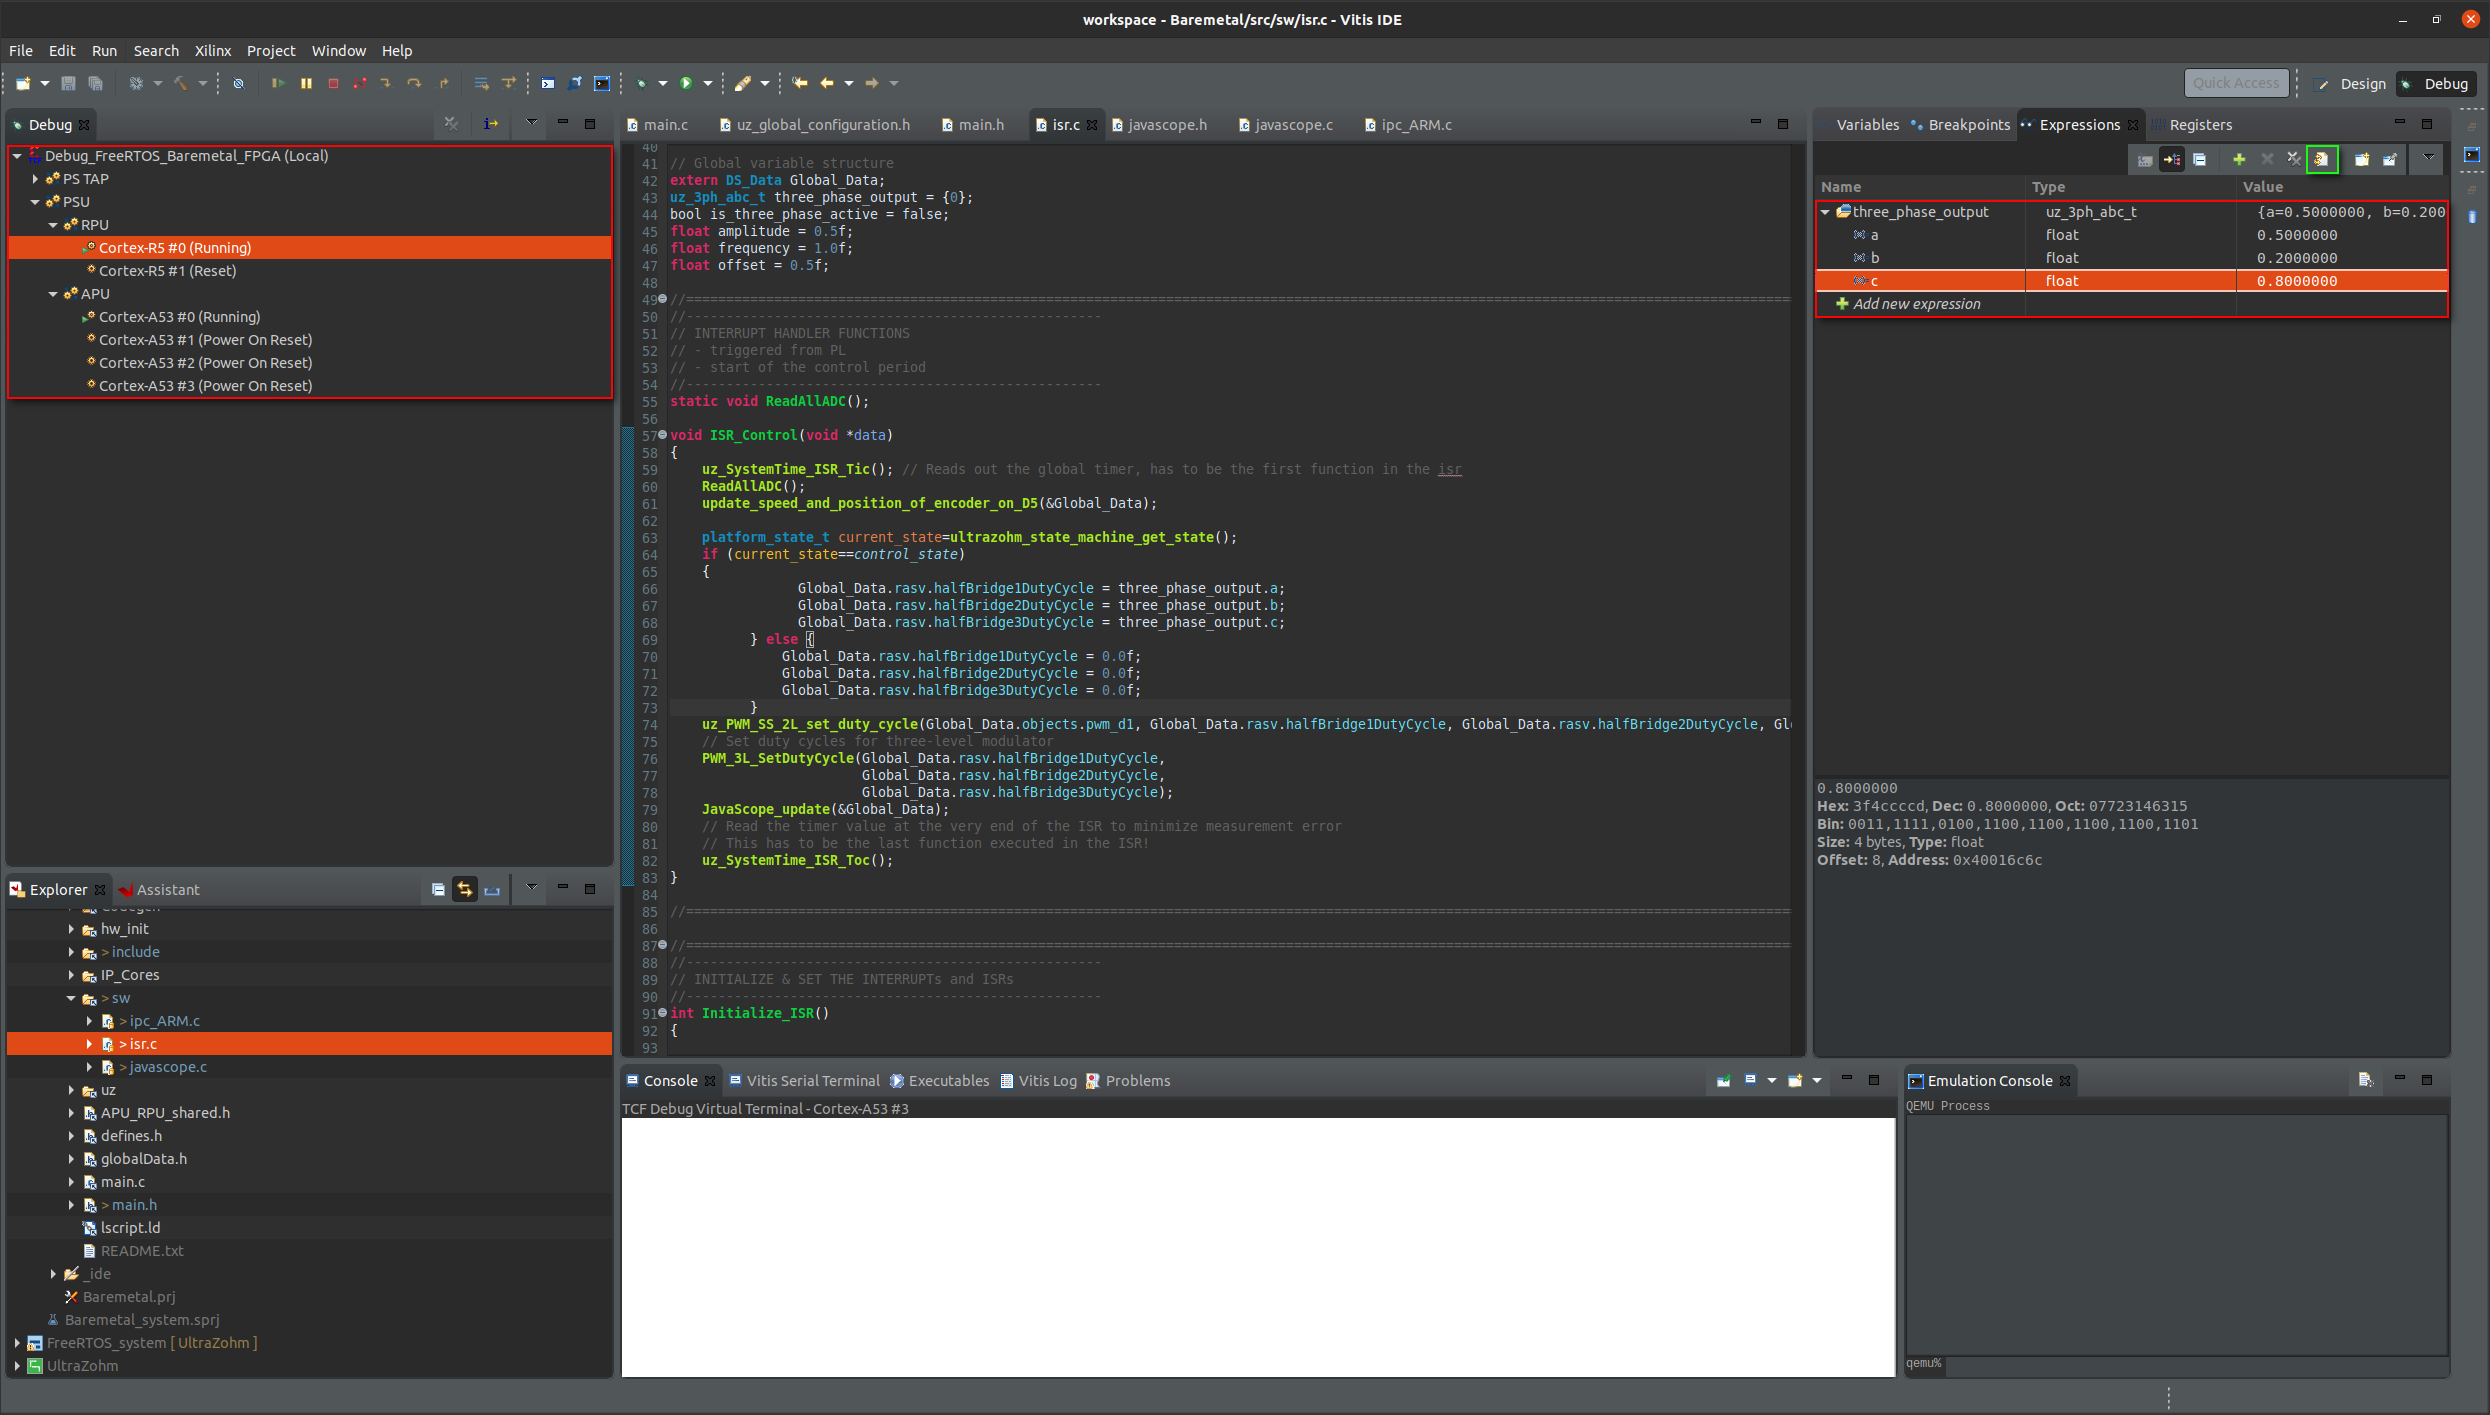
Fig. 12 Visible expression in Vitis.#
Try out different values for the three phases (which correlate to the DutyCycles of the gates) by changing the value in the expression tab and visualize them on the oscilloscope again.
Be wary, the value should be positive and not exceed 1.0f.
Otherwise an assertion will trigger again.
This concludes the fourth tutorial.