Data viewer (deprecated)#
Note
The dataviewer is deprecated and will be removed in the future! Use the more powerful uz_dataviewer.
The JavaScope is used to observe log data during operation of the UltraZohm. In addition, log files can be created, which can be further analyzed.
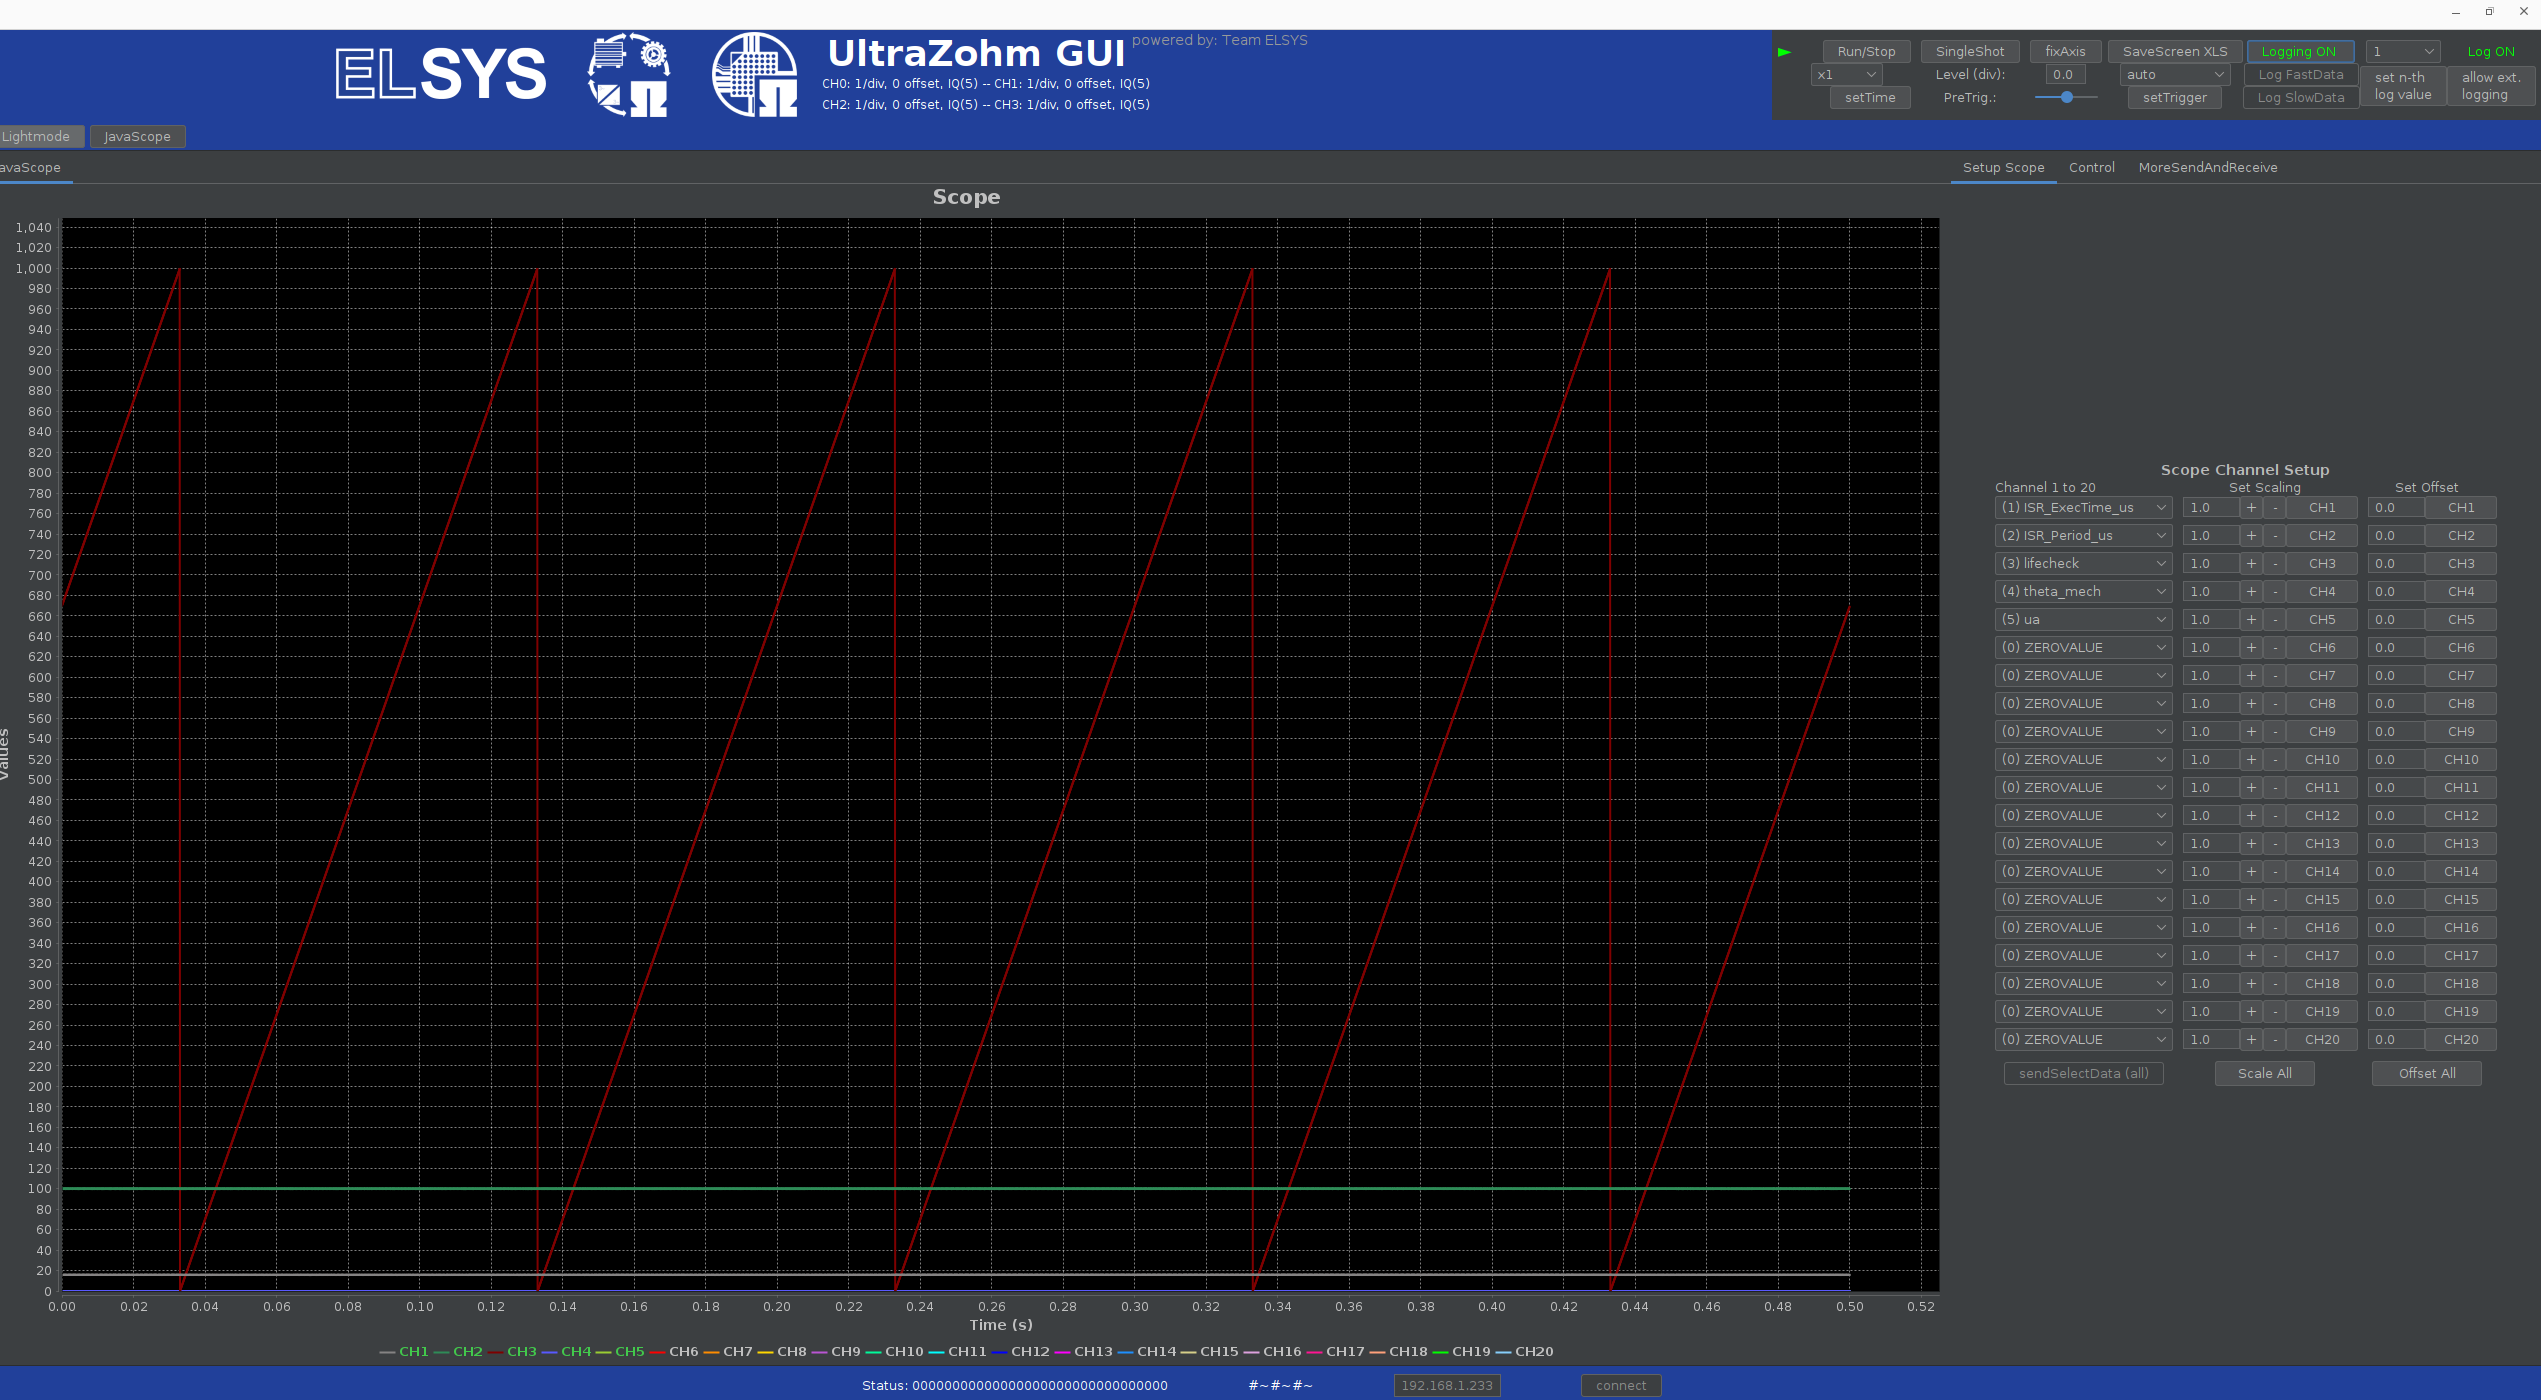
Fig. 94 Javascope logging the lifecheck signal.#
Fig. 94 shows logging the lifecheck signal of the UltraZohm. Two options are available to further analyze this log file:
Matlab Data Inspector#
To open the log file, open Matlab and navigate to ultrazohm_sw/javascope.
Make sure that this is the current working directory for Matlab.
Call the script JS_plot_data.m.
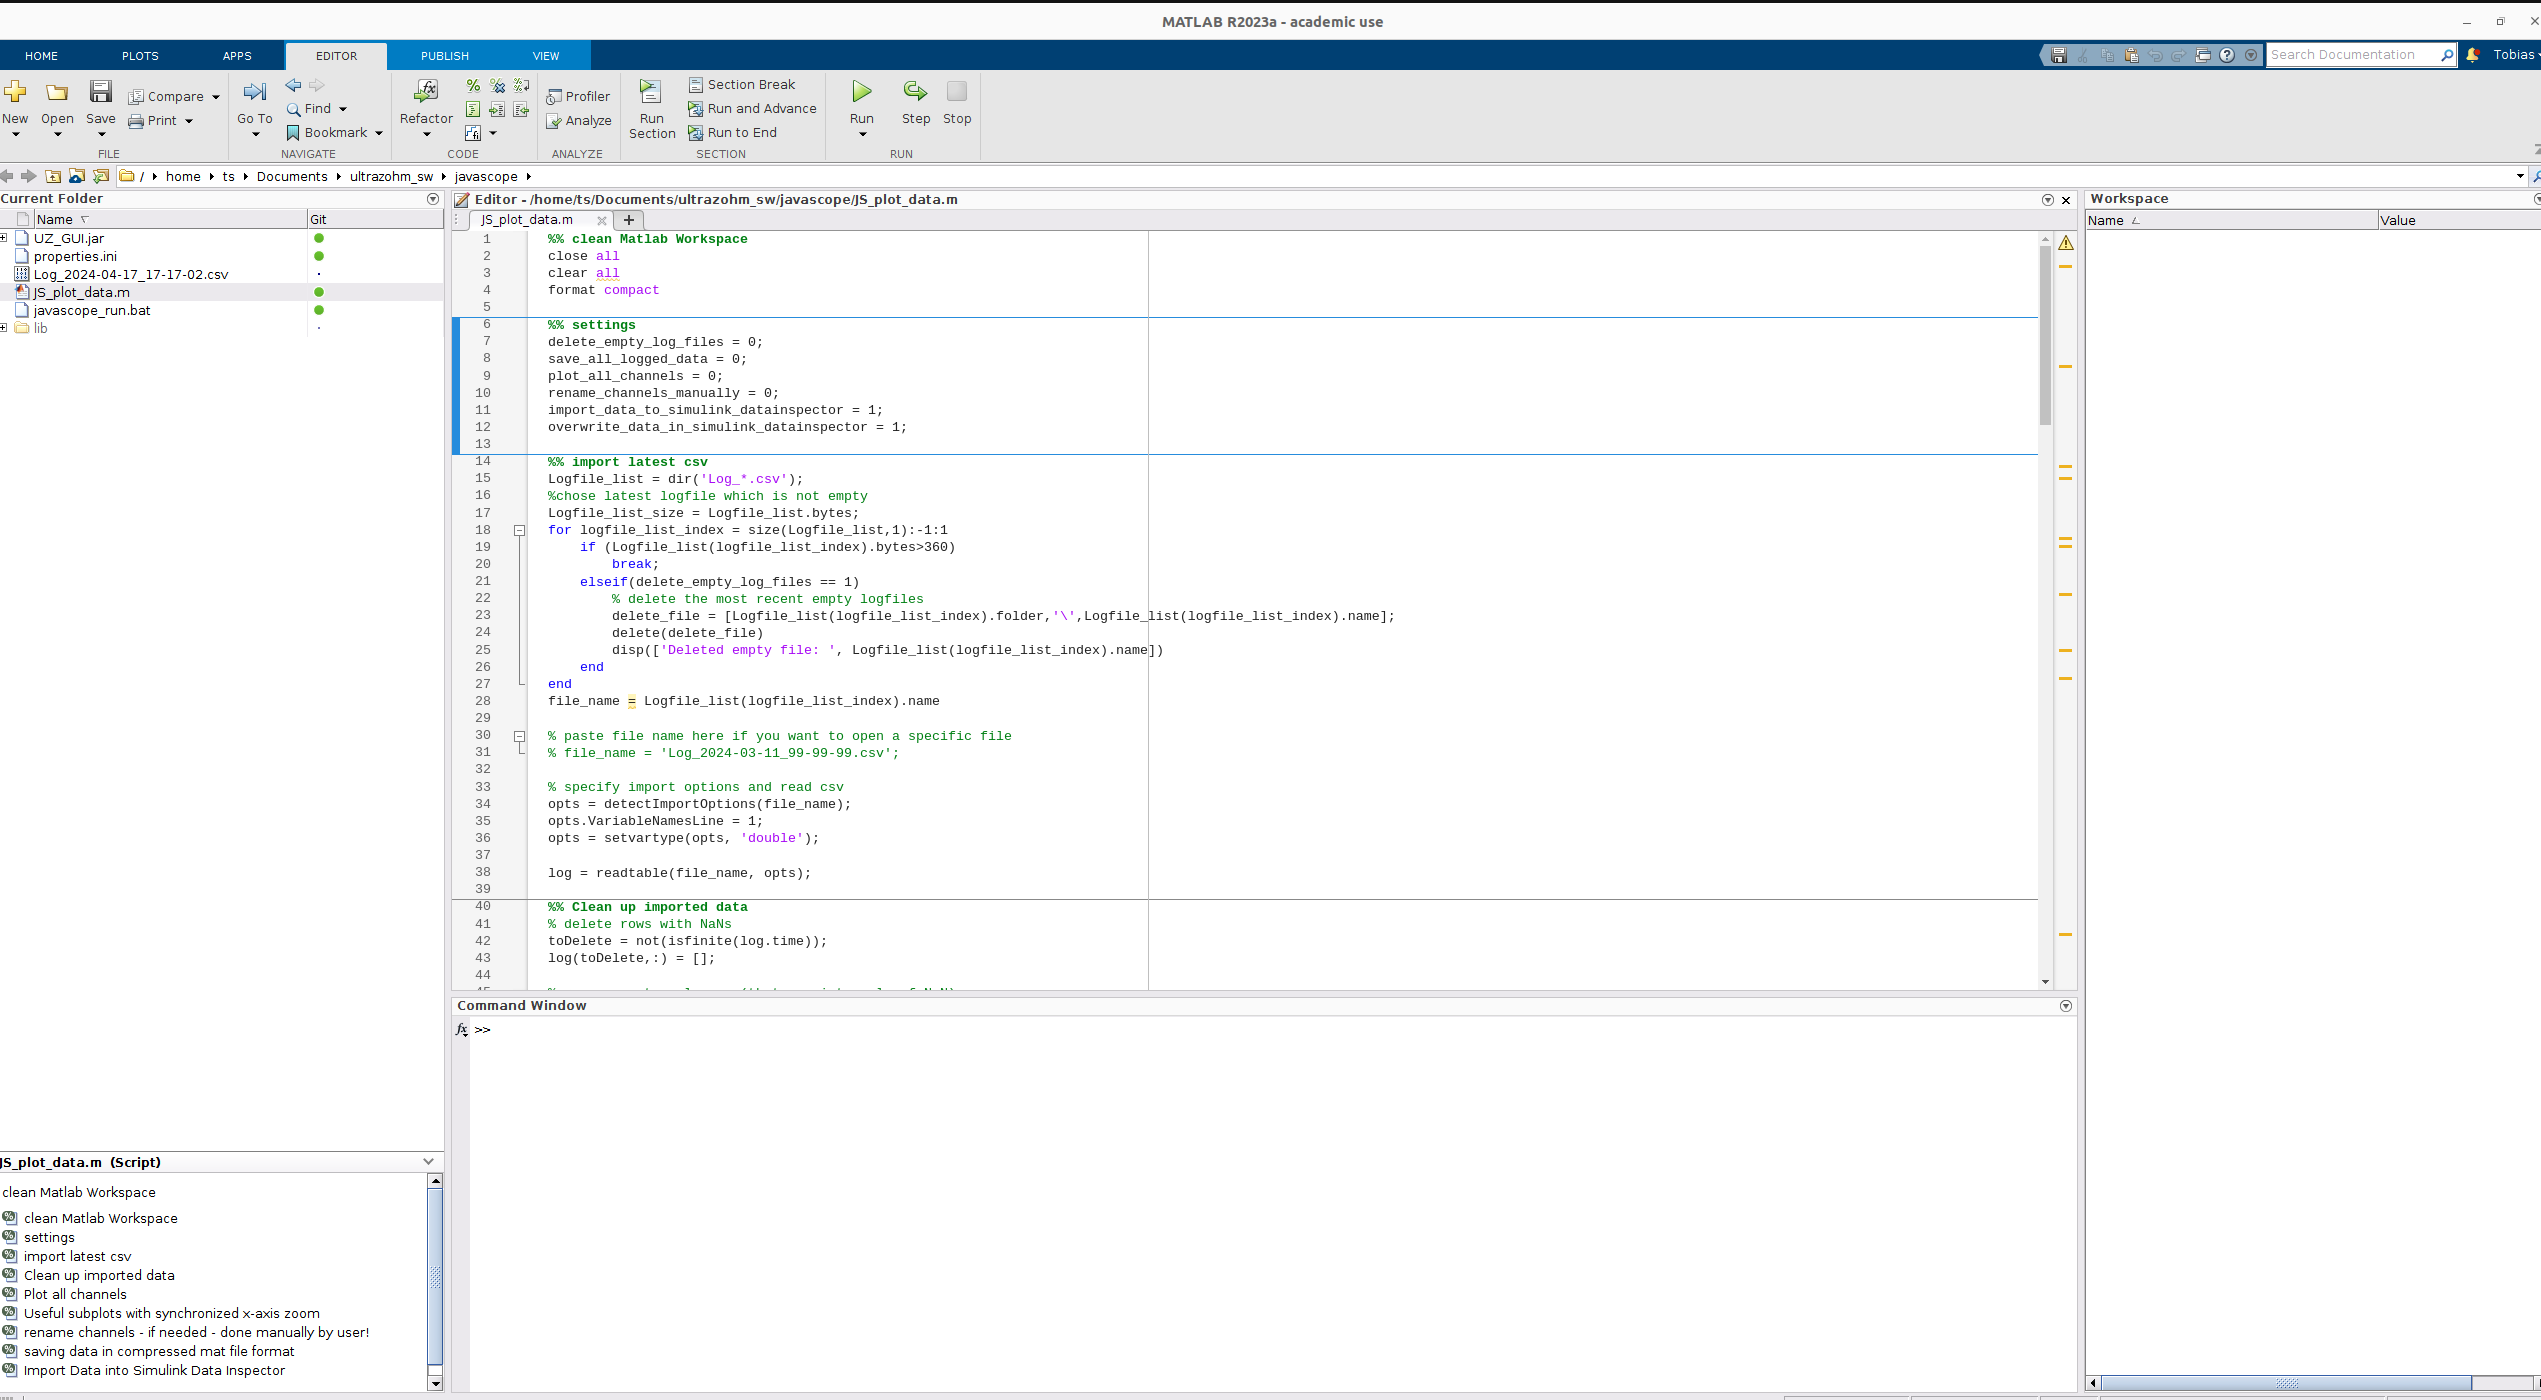
Fig. 95 Call JS_plot_data.m.#
The script opens the latest log that is present in ultrazohm_sw/javascope in the Matlab Data Inspector documentation.
The read data are also available in the Matlab workspace for further processing.
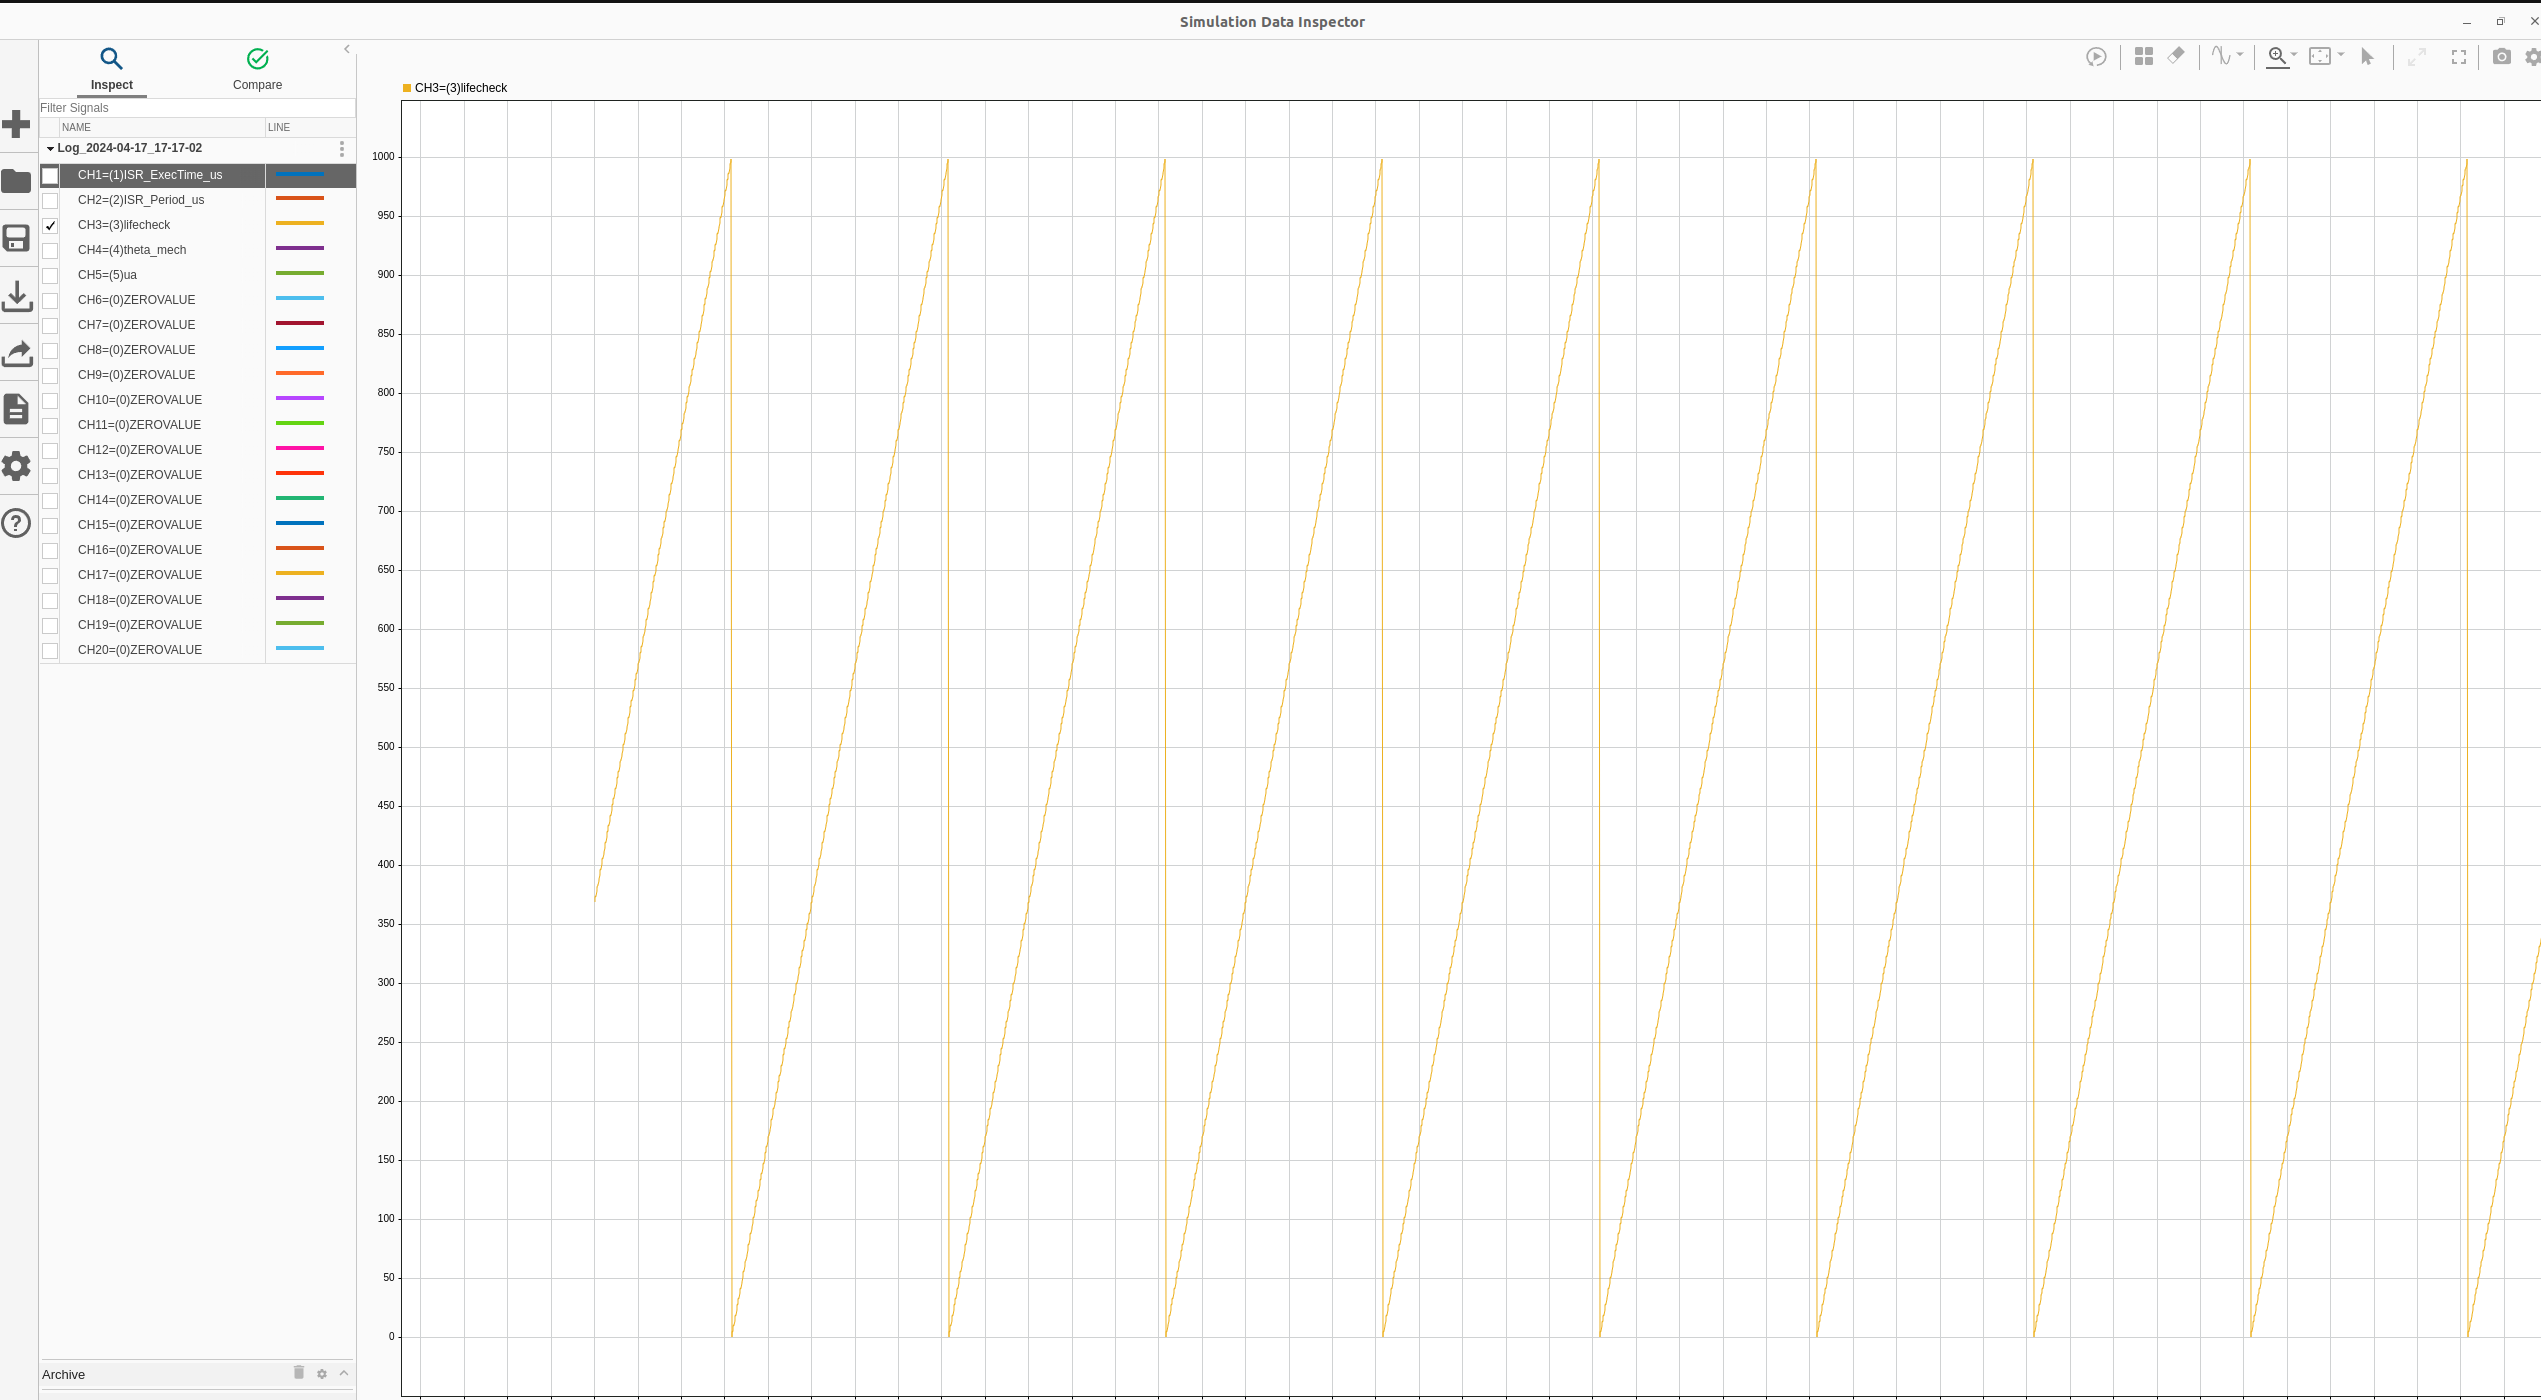
Fig. 96 Use the Matlab Data Inspector to analyze the data.#
To load a specific log file, set the file name accordingly, like so:
file_name = Logfile_list(logfile_list_index).name
paste file name here if you want to open a specific file
file_name = 'Log_2024-03-11_99-99-99.csv';
Additional settings, such as converting the log file to .mat for further usage in Matlab, can be set:
%% settings
delete_empty_log_files = 0;
save_all_logged_data = 0;
plot_all_channels = 0;
rename_channels_manually = 0;
import_data_to_simulink_datainspector = 1;
overwrite_data_in_simulink_datainspector = 1;
Python Data Viewer#
Note
The Python Data Viewer works out of the box inside the VS Code Remote Container. If the remote container is not used, the dependencies of ultrazohm_sw/docs have to be installed on the system.
The following steps start the Python-based data viewer:
Open a terminal and navigate to
ultrazohm_sw/javascopeCall the dataviewer like so
python dataviewer.py
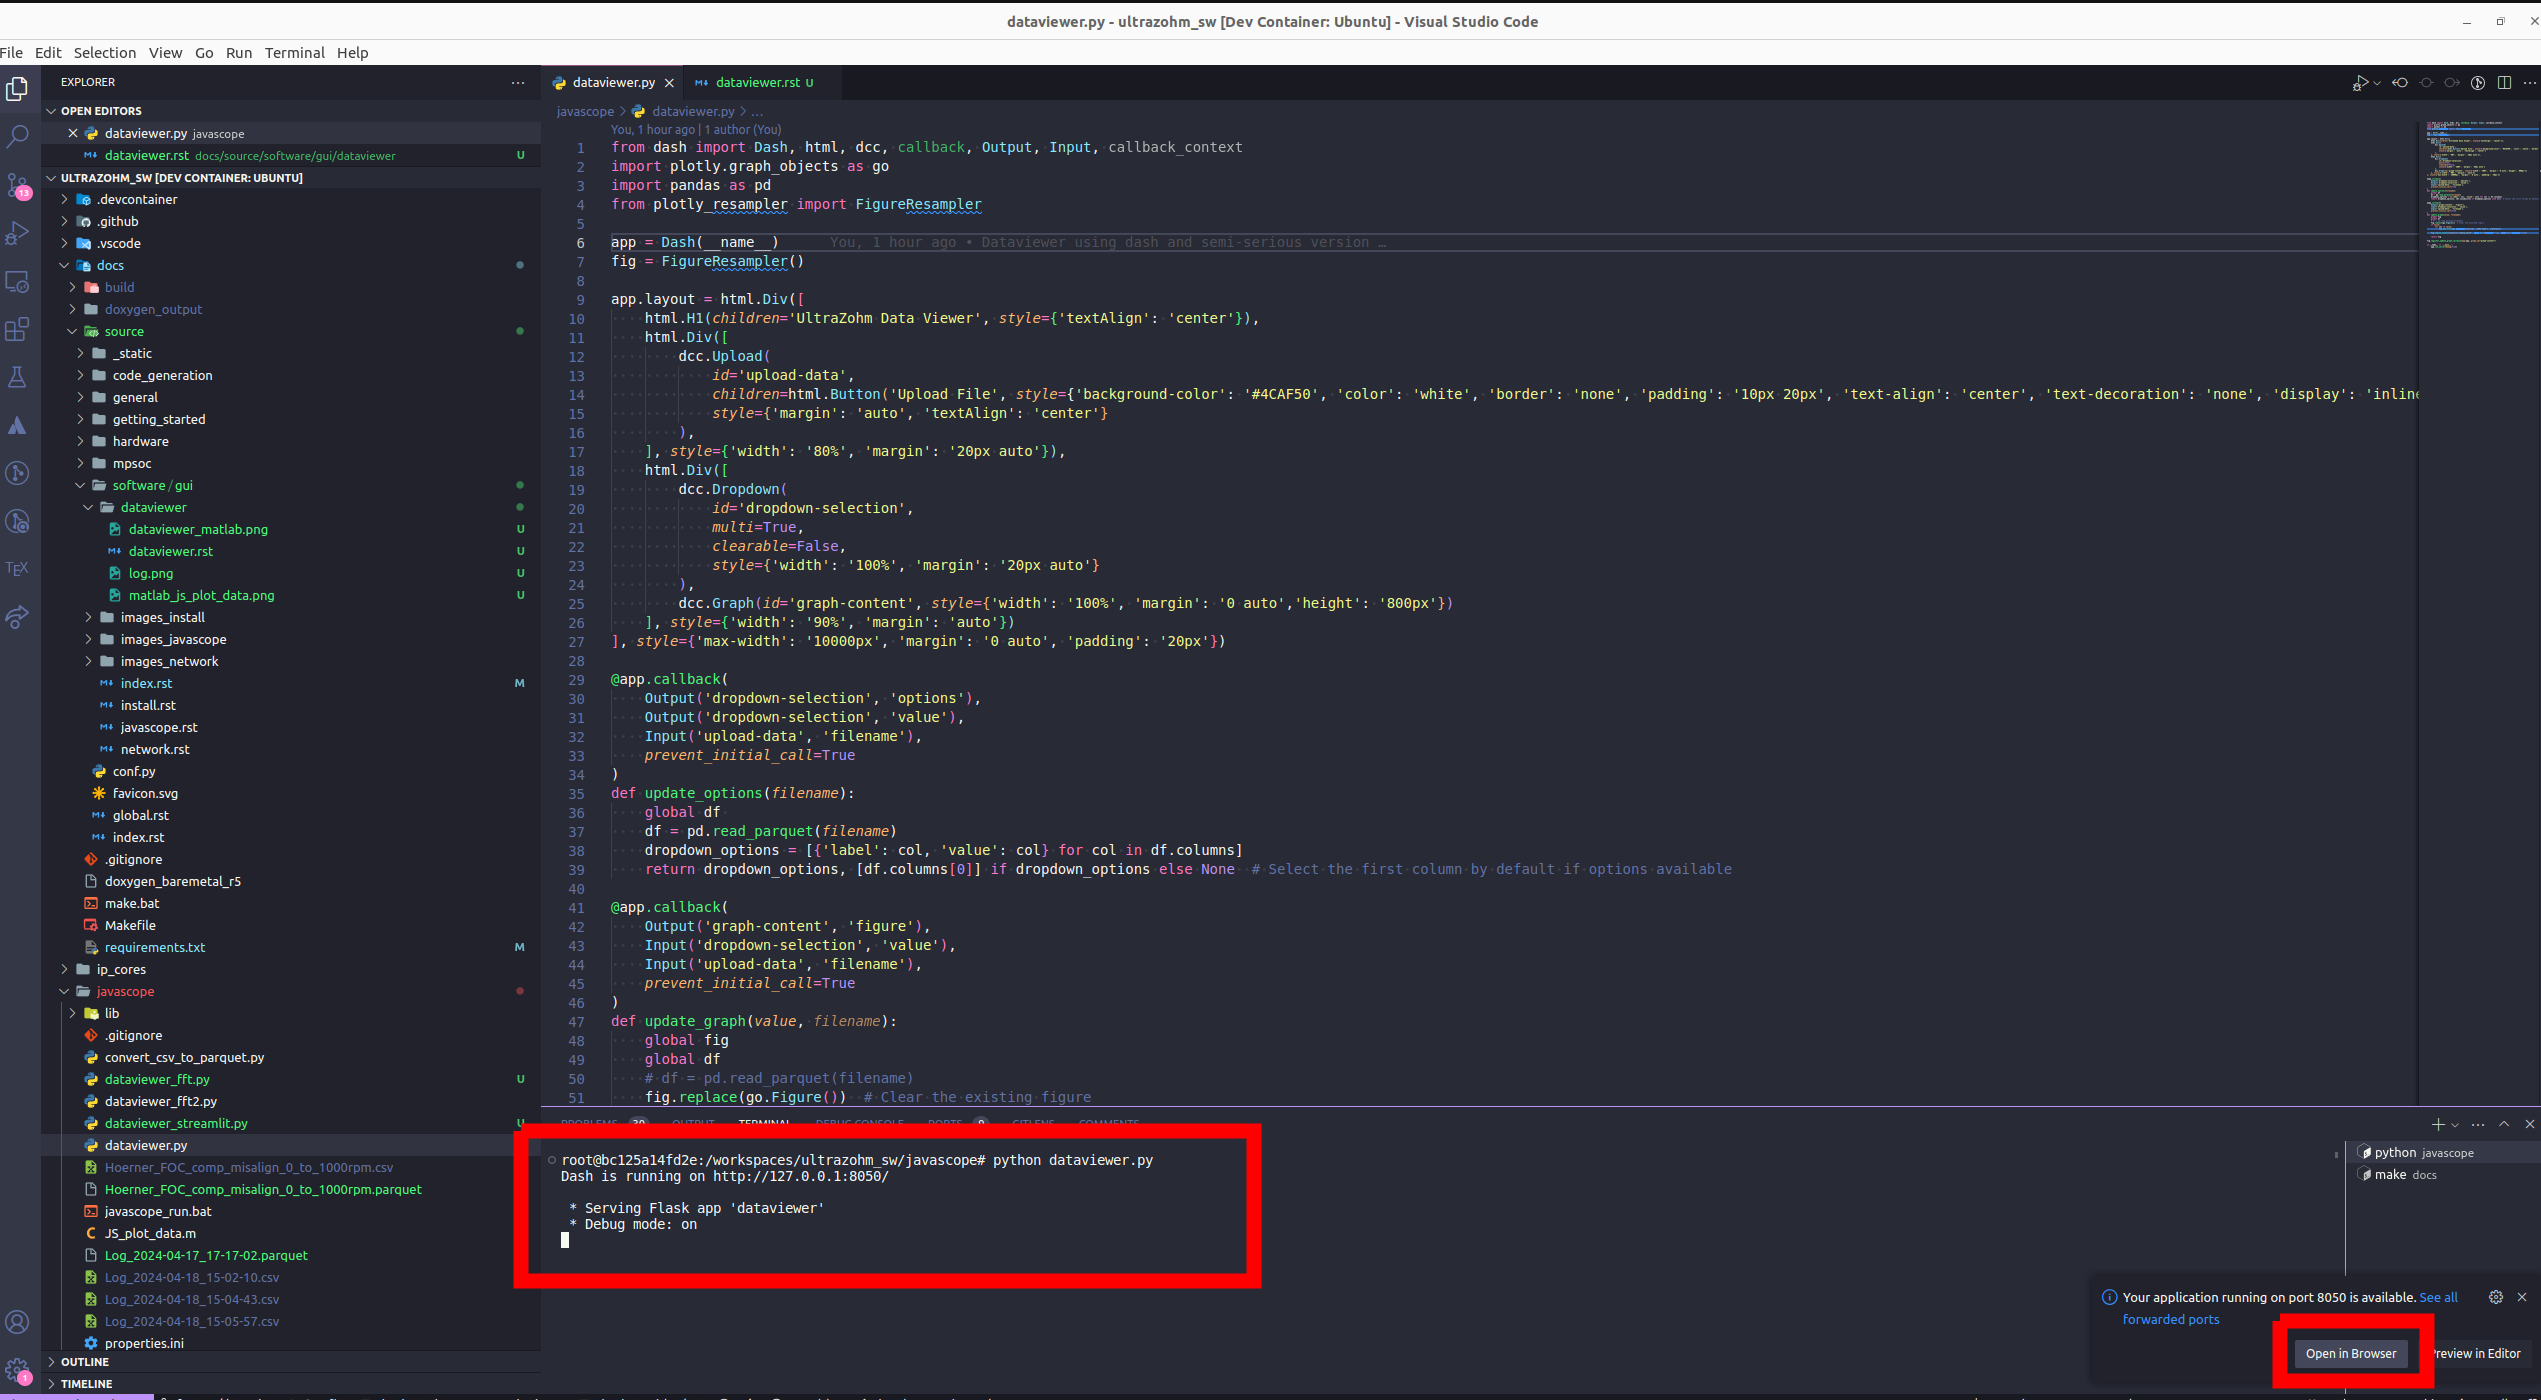
Fig. 97 Start the Python data viewer by calling dataviewer.py. A dash server is started, which can be opened by typing the IP into the browser or clicking the pop-up (right corner).#
Open the web page of the data viewer
Upload the log file that you want to inspect. Note that the data are only uploaded to your local machine since the dash app runs on a local server. I.e., all data are only present on your hard drive.
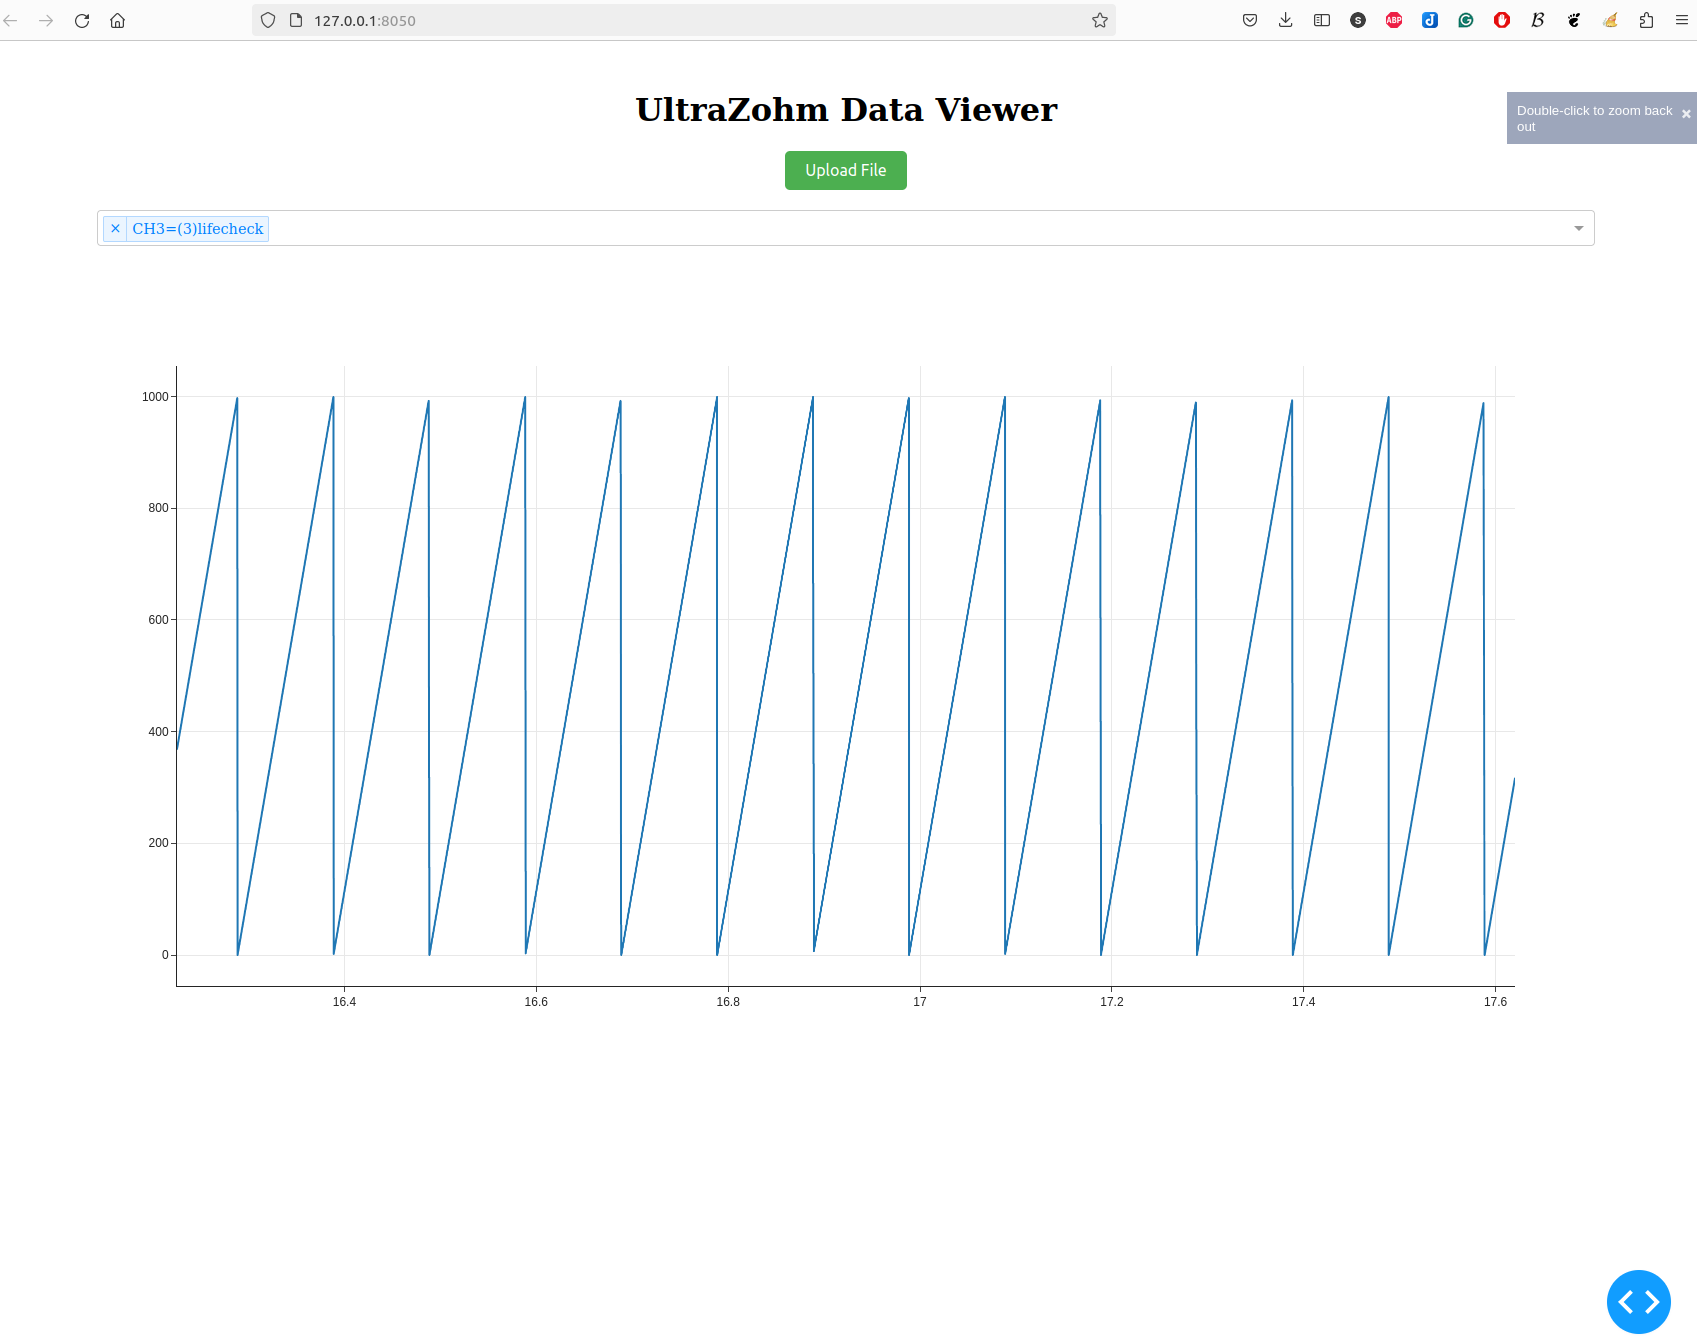
Fig. 98 Data viewer after uploading log data. The figure dynamically rescales using plotly resampler. Note that when viewing large timescales, aliasing might be present, which is reduced if the x-axis is zoomed in.#
Inspect the log file
Data format#
The Python-based data viewer can read .csv and .parquet (which stores the logs more efficiently, i.e., with less disk space).
Call convert_csv_to_parquet.py to convert all logs present in the directory to parquet data format, like so
python convert_csv_to_parquet.py