JavaScope#
This page documents the UltraZohm GUI in ultrazohm_sw/javascope.
Note
The GUI layout changed, but the Vitis-side integration is unchanged.
Customize javascope.h and javascope.c as described in JavaScope Customization.
For the legacy GUI, see JavaScope Legacy GUI (deprecated).
For updating legacy GUI files in older branches, see the legacy JavaScope upgrade note.
Folder contents#
The javascope folder contains:
javascope_run.batstarts the GUI on Windows.UZ_GUI.jaris the GUI binary.properties.inicontains the startup configuration that is loaded when the GUI starts.JS_plot_data.mis a MATLAB script that reads and plots recorded data.dataviewer.pyand the related Python helper scripts support offline analysis of recorded data.libcontains the required Java libraries.Log_yyyy-mm-dd_hh-mm-ss.csvis created when the logger is enabled.
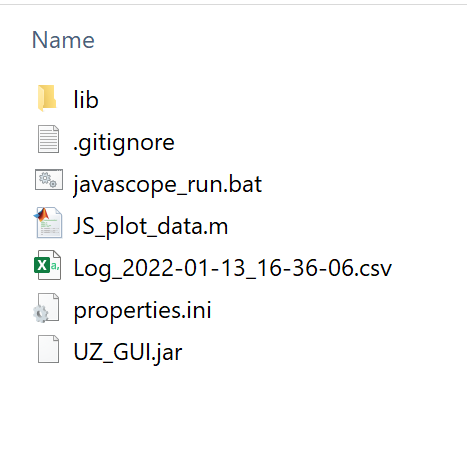
Fig. 84 JavaScope folder structure#
GUI source and build changes are maintained in the JavaScope source repository.
To run the binary in uz_sw, install JDK 21 or higher.
Basics#
At startup, JavaScope uses a Full HD window and falls back to fullscreen if required.
It then attempts to connect to the IP address in properties.ini.
After connection, it applies the preconfigured channel selection from properties.ini.
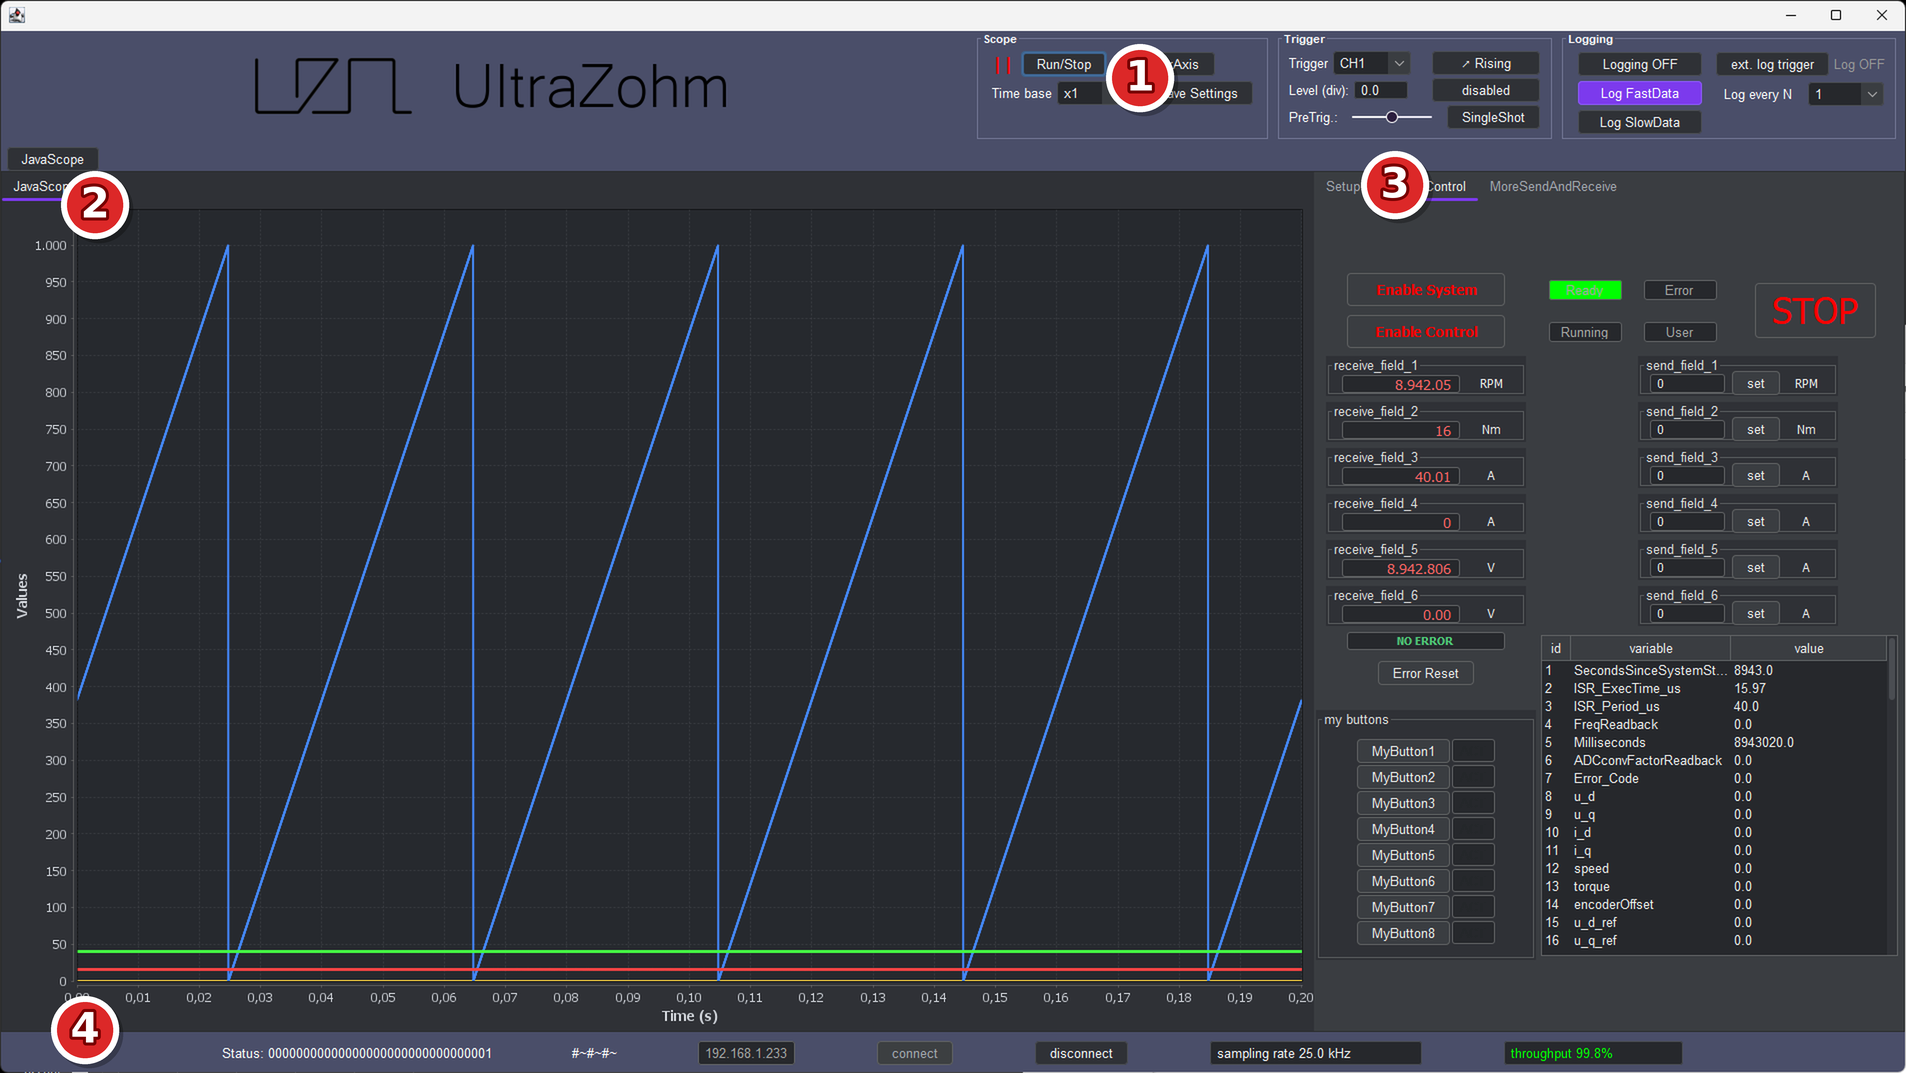
Fig. 85 JavaScope overview#
The header contains scope, trigger, and logging controls.
The plot displays up to 20 fast channels.
The right side contains the
Setup Scope,Control, andMoreSendAndReceivetabs.The footer shows runtime status, connection state, sampling rate, and throughput.
Header controls#
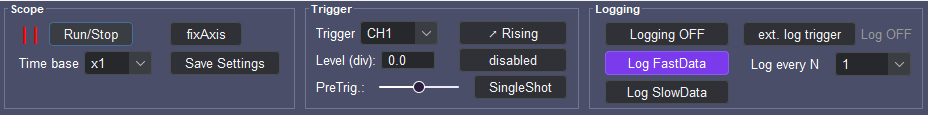
Fig. 86 JavaScope header controls#
Scope#
Run/Stopstarts or pauses acquisition display updates.Time basechanges the displayed time window by plotting every Nth sample.fixAxisdisables automatic axis rescaling during acquisition.Save Settingswrites trigger, channel, scaling, offset, and sampling-rate settings toproperties.ini.
Trigger#
Trigger channelselects the trigger source.RisingorFallingselects the signal edge.Trigger enableenables or disables triggered acquisition.Levelsets the trigger threshold.PreTrig.sets the fraction of pre-trigger data in the capture window.SingleShotarms one triggered capture and freezes the display after the next valid event.
Logging#
Logging OFF/ONstarts or stops writing log files.Log FastDataincludes fast scope samples in the log file.Log SlowDataincludesSlowDatavalues in the log file. All receivedSlowDatais logged.ext. log triggerallows the UltraZohm software to control logging via its status bit.Log every Nreduces the logging rate of FastData by saving only every Nth sample group. If enabled,SlowDatais logged at full rate.Log stateshows whether logging is active.Each logging start creates a new
Log_yyyy-mm-dd_hh-mm-ss.csvfile.
Footer and connection area#

Fig. 87 JavaScope footer and connection controls#
Statusshows 32-bit status register.Connection indicatormoves when new data package arrives.IP addressshows the target device address.connectopens the connection to the UltraZohm at the configured IP address.disconnectcloses the active connection.Sampling rateshows the configured or detected acquisition rate.Throughputshows the fraction of the expected data stream received. If throughput drops below 95 % of the expected rate, the text turns red.
Description of tabs and controls#
Setup Scope tab#
The Setup Scope tab selects displayed signals and adjusts per-channel vertical scaling.
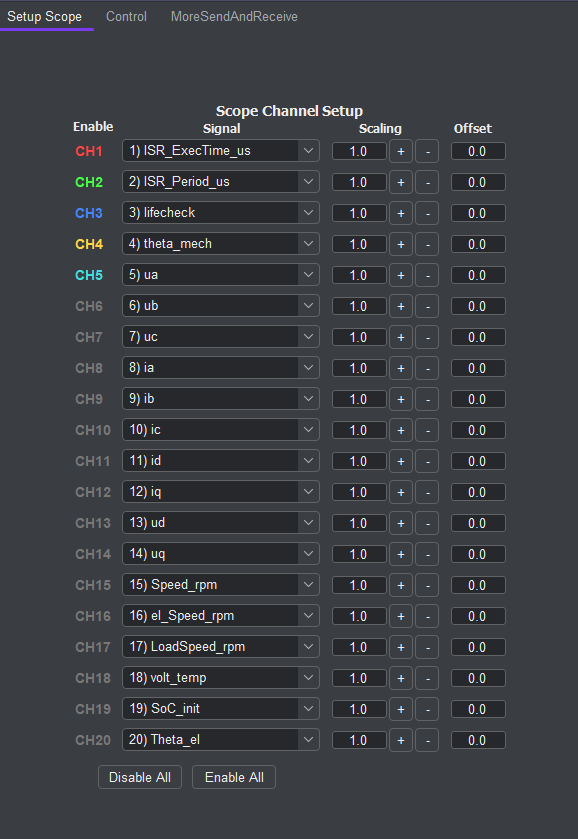
Fig. 88 JavaScope Setup Scope tab#
Each of the 20 scope channels provides the following options:
Enabletoggles by clicking onCHx. Colored when active, gray when disabled.Signalselection. Use num-pad for quick access in the drop-down menu.Scalingwith direct entry and+/-buttons. The displayed value is scaled by1/scaling.Offsetentry to shift the signal on the y-axis.Enable AllandDisable Allfor global channel visibility control.
Available signal names are parsed from JS_ObservableData in javascope.h.
On connection, the GUI sends the preselected channel configuration automatically.
Channel selection changes are applied immediately while connected.
Scaling and offset are applied when you press Enter or move focus away from the input field.
Control tab#
The Control tab is the main interface for state-machine control, user inputs, and selected SlowData.
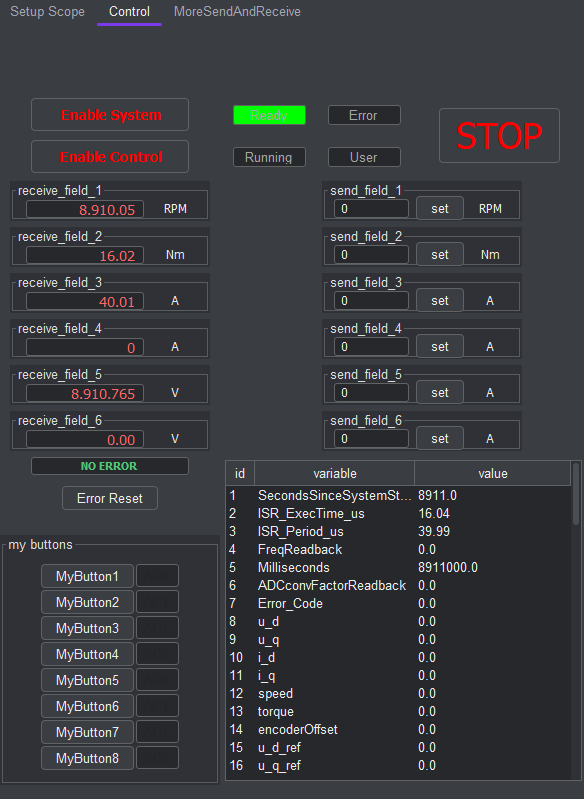
Fig. 89 JavaScope Control tab#
Enable System,Enable Control, andSTOPmap to the front-panel state-machine buttons. For details on the R5 states and transitions, see R5 state machine.Note for ≥Rev05-based UltraZohm systems
With ≥Rev05 carrier boards, the STOP and Enable buttons on the front panel affect functions beyond the UZ software and must be considered when using JavaScope. See the “Warning” info-box in the “Powerbutton Functionality” documentation of the Rev05 carrier board for details.
Ready,Running,Error, andUsermap to the front-panel status LEDs. If anassertoccurs in the UltraZohm, JavaScope disconnects, and theErrorLED may only be visible on the hardware front panel.The
receive_fieldsSelected user-defined
SlowDatavalues can be shown more prominently here than in theSlowDatatable.For configuring which values are shown here, see JavaScope Customization.
If not all of the up to 20 channels are required, they can be set to
JSSD_FLOAT_ZEROVALUE.
The
send_fields20 values are available as references or setpoints for the user application.
After entering a value, press
enteror thesetbutton to send it to the R5. Inipc_ARM.c, you can define how the value is used in the application.
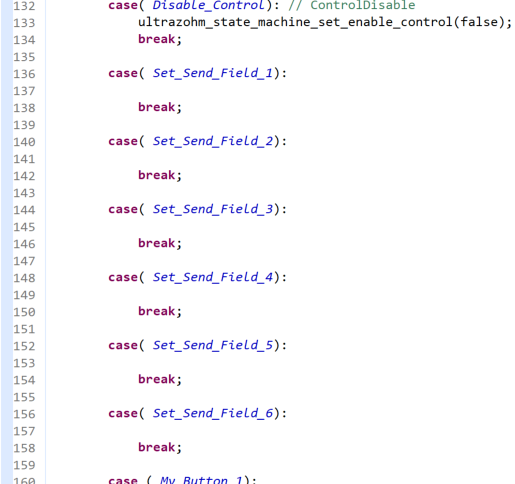
Fig. 90 Part of
ipc_ARM.ccode path wheresend_field_xvalues are received#The
mybuttonsIn addition to the
send_fieldvalues, eight user buttons are available. Inipc_ARM.c, you can define what happens when the buttons are pressed.Each button has a status indicator below it. This indicator can also be set in
ipc_ARM.cto provide feedback for button actions. See/* Bit 4 - My_Button_1 */in the right picture below for an example.
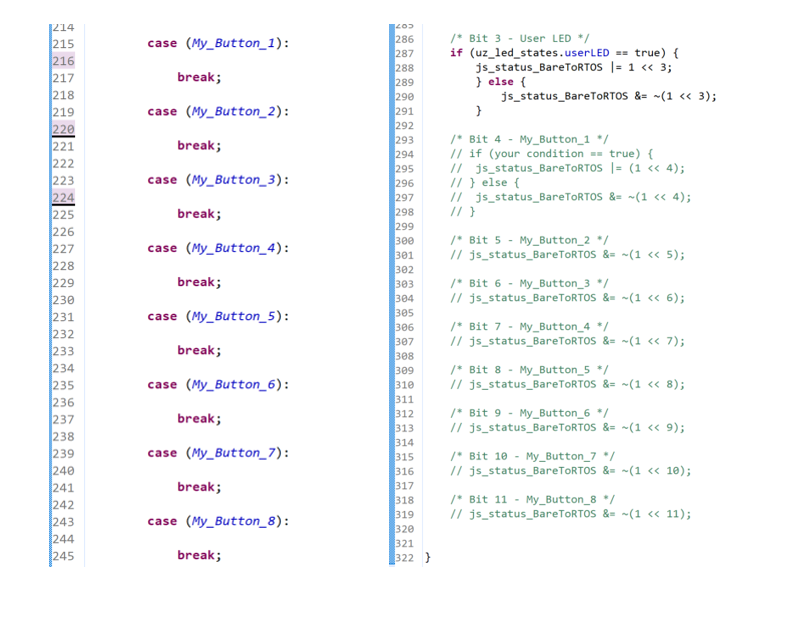
Fig. 91 left: further use of the buttons; right: control of the button status indicators#
The
SlowDatatable lists all parsedSlowDataentries fromjavascope.h(see JavaScope Customization). Rows in theSlowDatatable can be copied viaCtrl+Cor the context menu. The more values are displayed, the longer it takes until they are updated.Error Resetand theerror codefield provide fault handling.The behavior of
Error Resetmust also be programmed inipc_ARM.c.To send error codes to the GUI for display in the
error codefield, use theSlowDatavariableJSSD_FLOAT_Error_Code.
Warning
Error detection and handling have to be implemented by the user. The GUI just provides an interface.
Vitis-side user C-code integration is unchanged:
send_field_x values, receive_field_x mappings, error-code handling, button labels, and the eight my buttons are configured in javascope.h and javascope.c.
More Send and Receive tab#
The MoreSendAndReceive tab extends Control with the remaining receive and send fields.
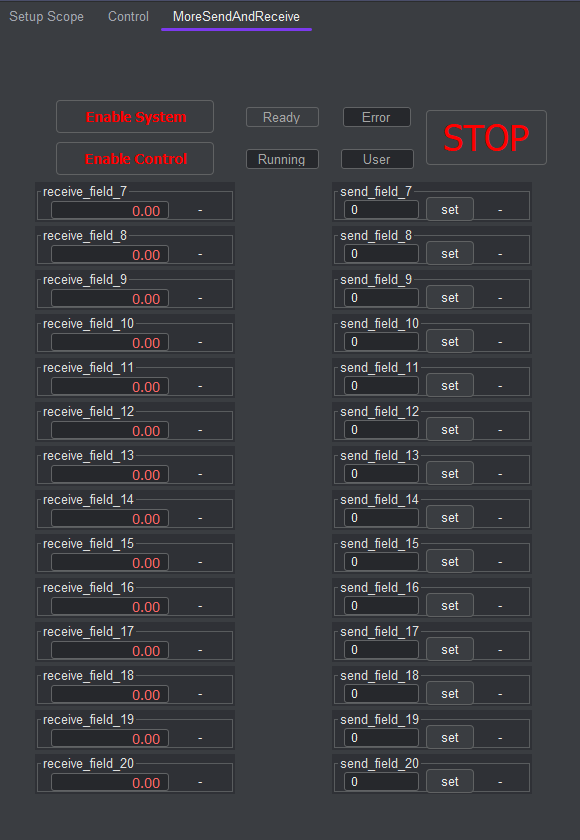
Fig. 92 JavaScope More Send and Receive tab#
receive_field_7toreceive_field_20.send_field_7tosend_field_20.A duplicated control/status block for common state-machine actions.
This tab is intended for operation with more than six receive or send fields.
Note
If ScopeDevTab = 1 is set in properties.ini, an additional ScopeDev tab is shown.
It contains developer tools such as the pause-ack toggle, throughput readout in MBit/s, and the lifecheck monitor for packet-gap detection.
Configuration and customization#
Customization is documented in JavaScope Customization.