JavaScope Legacy GUI (deprecated)#
This page preserves the documentation of the legacy JavaScope GUI in the folder ultrazohm_sw/javascope.
Warning
This page documents the legacy GUI only. For the current GUI, see JavaScope. Shared configuration and customization of both GUI generations are documented in JavaScope Customization.
Note
Older branches can update the legacy JavaScope files directly from develop.
Run the following commands from the repository root.
git fetch origin
git restore --source origin/develop -- javascope/UZ_GUI.jar javascope/lib
This upgrades all JavaScope files to the version that is currently in develop, including added and removed libraries in javascope/lib.
The folder contains the following files:
javascope_run.batis the executable for Windows, start it by double-clickingUZ_GUI.jaris the binary file of the JavaScope, the sources are in a separate repositoryproperties.iniis the configuration file that is loaded when starting the JavaScopeJS_plot_data.mis a MATLAB script that reads and plots the measurement datalibis the folder including the required Java librariesLog_yyyy-mm-dd_hh-mm-ss.csvis a log file that is created at every startup of the GUI
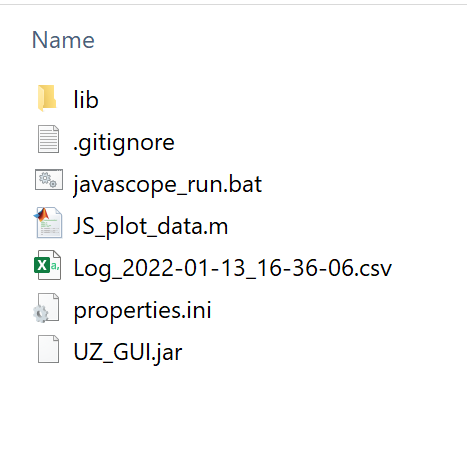
Fig. 77 JavaScope folder structure#
Basics#
The GUI is shown in Fig. 78.
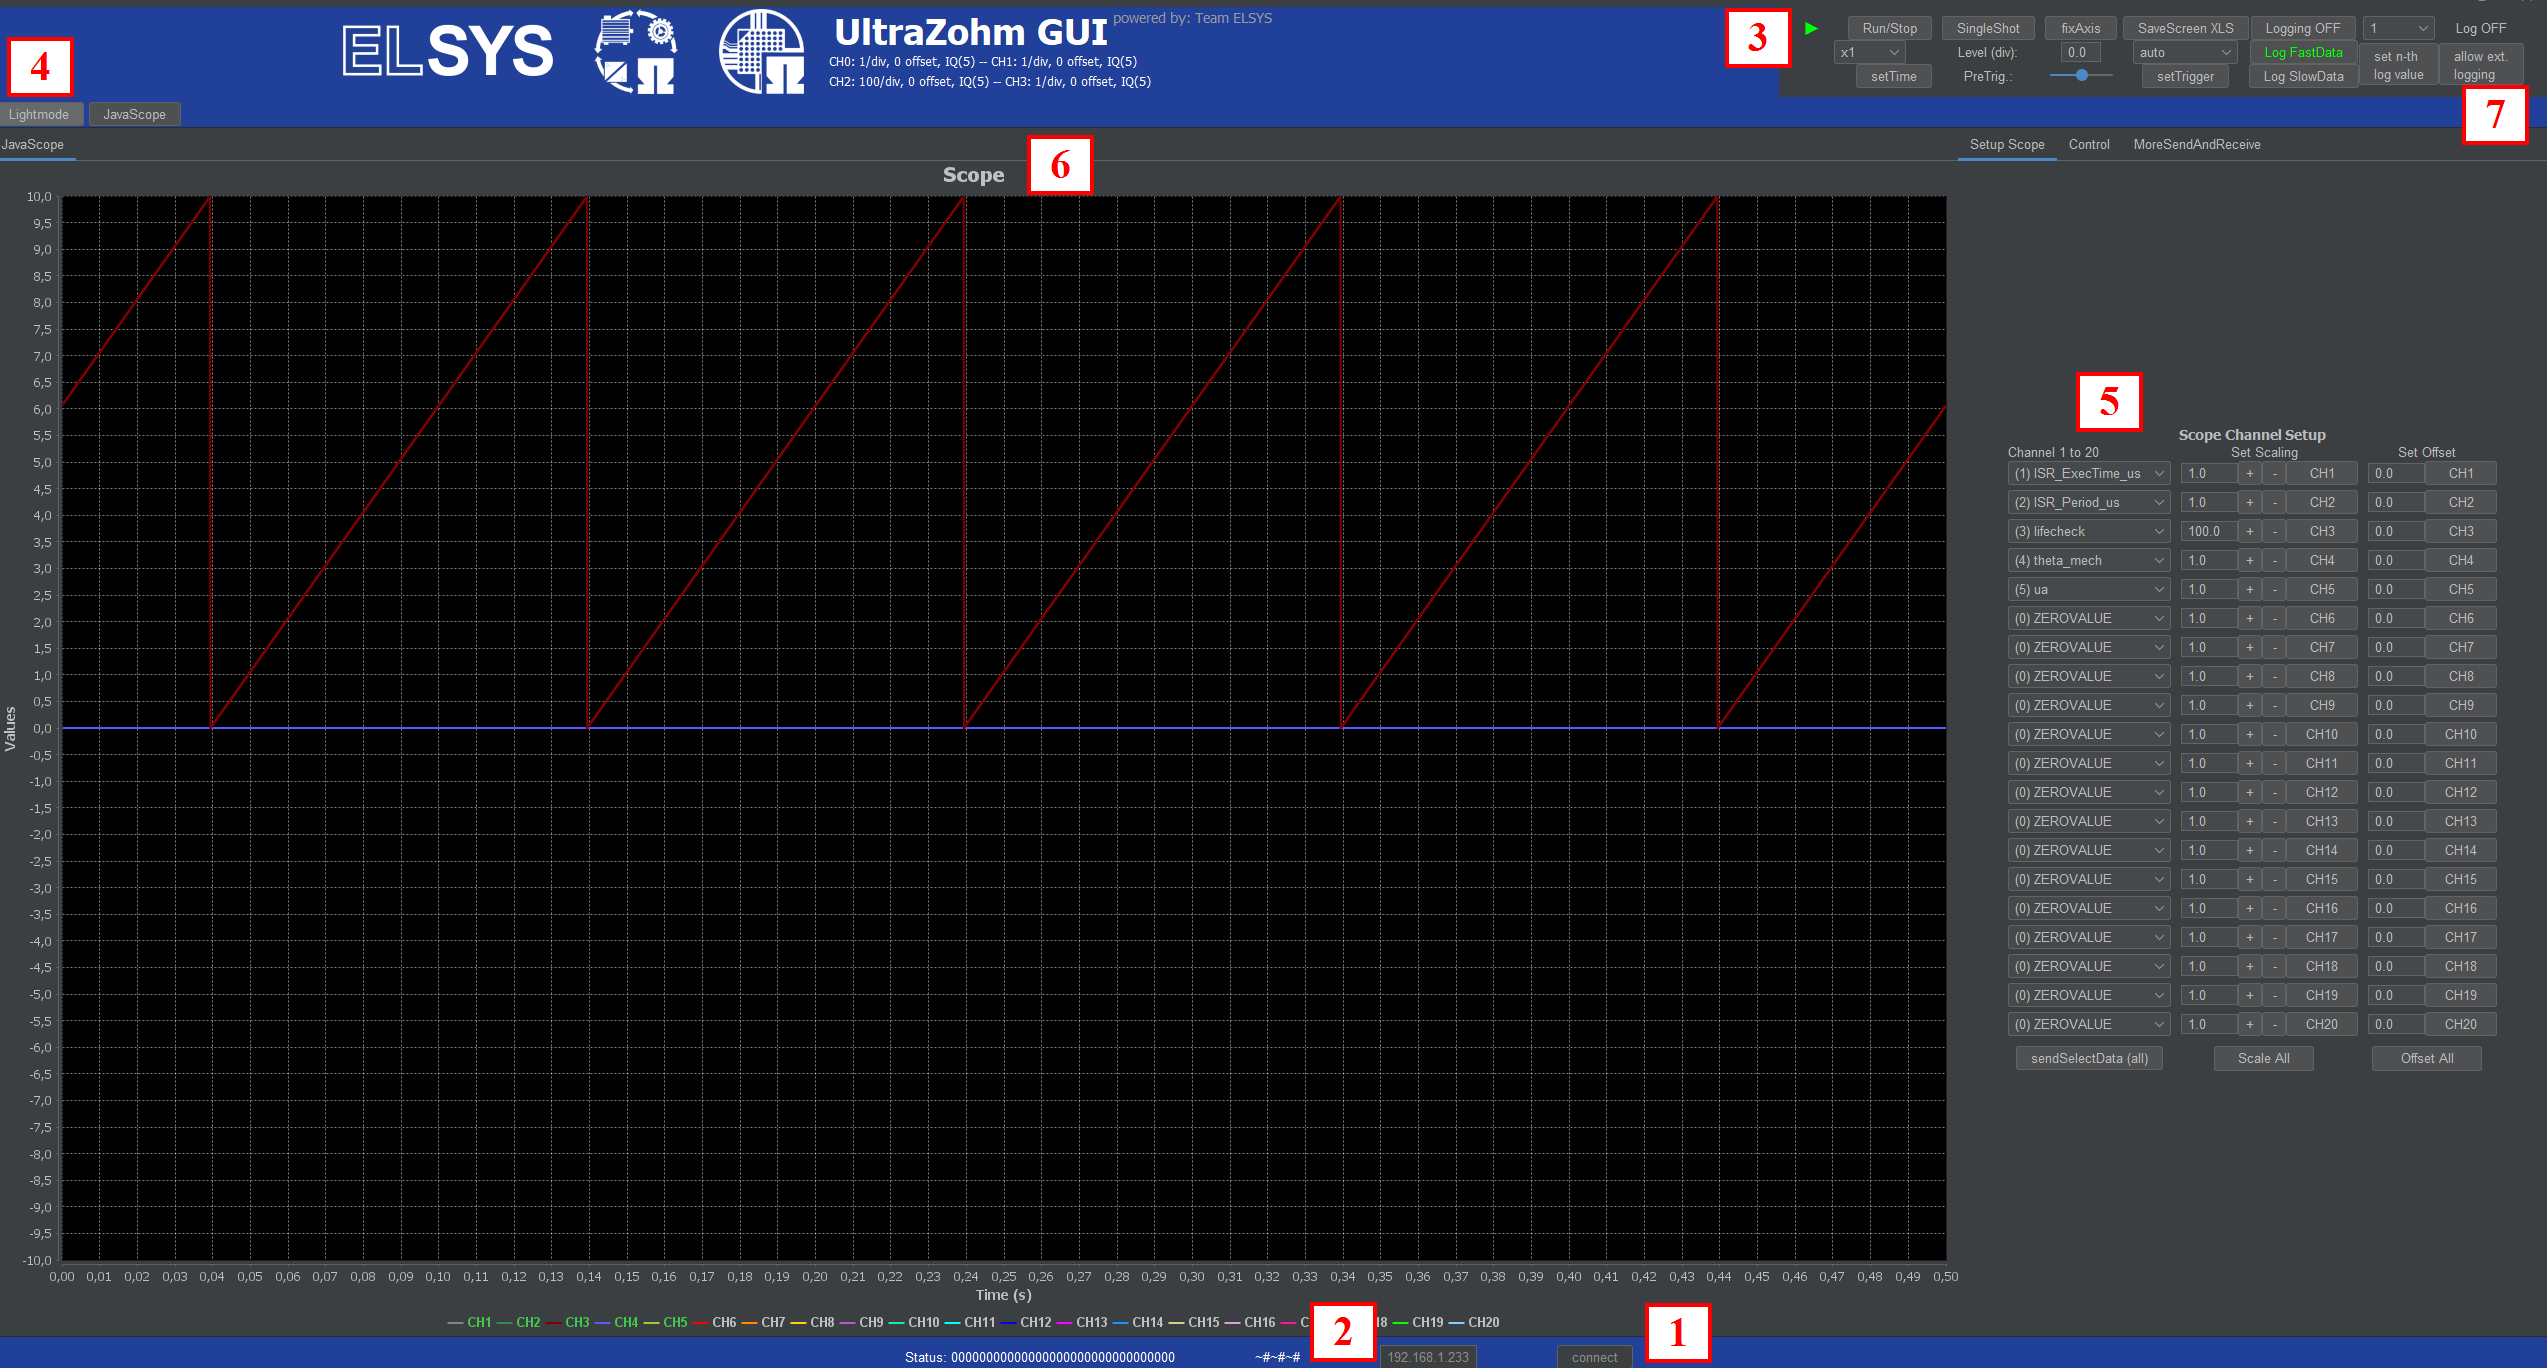
Fig. 78 GUI#
First, press the
connectbutton (1) in order to connect your scope to the UltraZohm.You will see some moving signs at (2) if the connection was successful.
The
Stop(3) orRunbutton stops or restarts the scope. After the connection has been established, the scope will be put into theRunmode automatically.You can switch between a Lightmode and Darkmode for the GUI on the fly.
Go to the
Setup Scopepanel and presssendSelectData (all)to get the pre-selected values from the drop-down menus on the scope. For changing the entries of the drop-down menus, see JavaScope Customization.In the time-based scope it is possible to debug up to 20 values by receiving data from the ISR (R5 processor).
In the top panel it is possible to configure the data logging and time scale.
Description of the buttons and pages#
Setup Scope page#
The Setup Scope page is used to adjust the scope settings during operation.
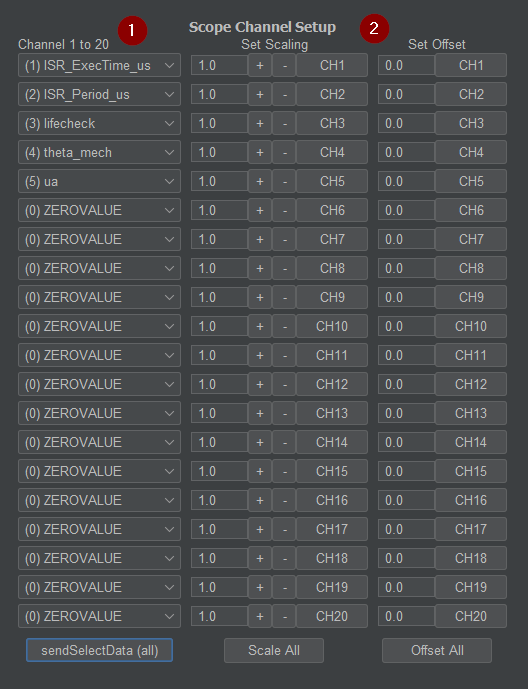
Fig. 79 JavaScope Setup tab#
Up to 20 channels, out of a predefined variable selection, can be chosen and displayed.
If other variables than the predefined ones are necessary, just change them in the
ipc_ARM.cfile of the R5 processor (see JavaScope Customization). Do not forget to press thesendSelectData (all)button after selecting signals from the drop-down menus if you want to change them!Each channel can have a specific scale factor and an offset.
The scale factor is comparable to the scale factor of an oscilloscope. It changes the value per grid unit.
Do not forget to press the
CHxbutton in theSet Scalingcolumn if you want to change the scaling! Scaling can also be adjusted by clicking the+and-buttons. For setting offsets to the channels, type the offset value into the proper field and press theCHxbutton of the respective channel. TheScale AllandOffset Allbuttons will update the respective settings for all 20 channels.
Control page#
The control page is used to step through the state-machine of the system and for setting commands and reference values. All buttons and LEDs of the front panel are mirrored in the GUI. In addition, some slow data can be visualized.
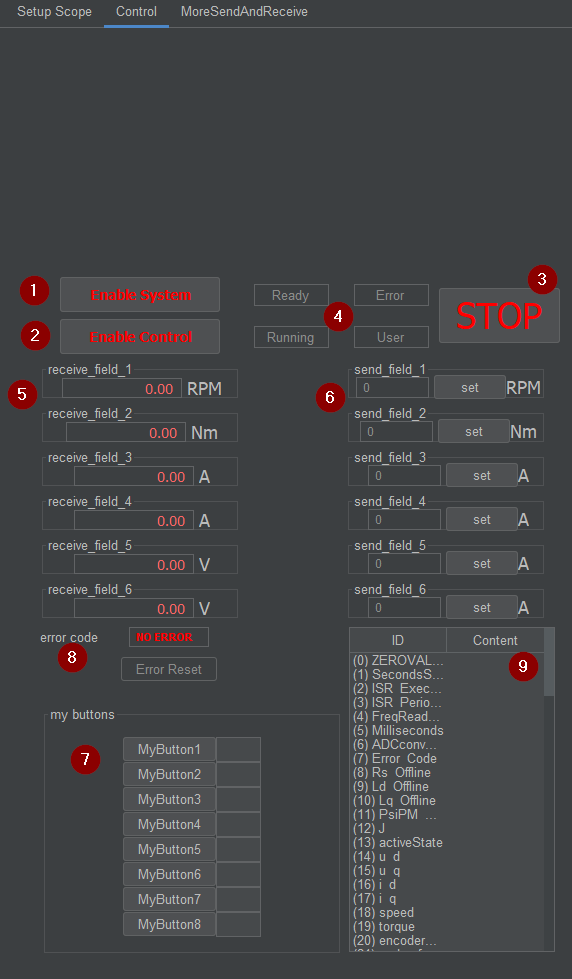
Fig. 80 Javascope Control tab#
The
Enable Systembutton has the same functionality as the hardware button on the main front panel.It sets the system state to enable, which mainly enables I/O and PWM pins.
When the enable is confirmed by the R5 of the UltraZohm, the
ReadyLED on the front panel as well as its mirrored twin in the GUI will blink faster.
The
Enable Controlbutton has the same functionality as the hardware button on the main front panel.It sets the system state to enable control, which mainly executes a part of the ISR of the R5 where the user should place their real-time application code.
When the enable is confirmed by the R5 of the UltraZohm, the
RunningLED on the front panel as well as its mirrored twin in the GUI will turn on in addition to the blinkingReadyLED.
The
STOPbutton has the same functionality as the hardware button on the main front panel.It disables the control and system enable states. I/Os and PWM are deactivated and the real-time application code in the ISR is no longer executed.
From returning to the slow blinking of the
ReadyLED and turning off theRunningLED it can be seen that the stop command was confirmed by the R5.
Note for ≥Rev05-based UltraZohm systems
With ≥Rev05 carrier boards, the STOP and Enable buttons on the front panel have an effect beyond the UZ software that has to be considered when using the JavaScope. Please refer to the “Warning” info-box in the “Powerbutton Functionality” documentation of the Rev05 carrier board for details.
The four LEDs mirror the LEDs of the front panel and always show the same state as the real LEDs do. In the case of an
assertevent in the UltraZohm, no data are transferred anymore to the GUI. In this case, theErrorLED will only be seen on the real hardware front panel.The
receive_fieldsHere, some user-defined slow data values can be visualized more prominently than in the slow data table.
For the selection of which values are shown here, see section JavaScope Customization.
If not all of the up to 20 channels are required, they can be set to
JSSD_FLOAT_ZEROVALUE. They won’t be displayed then. Furthermore, they won’t be logged either.
The
send_fieldsTwenty values are available that can be used as references or setpoints for the user application.
After typing in a value, press
setfor sending it to the R5. Inipc_ARM.cone can choose further usage of the value inside the application.
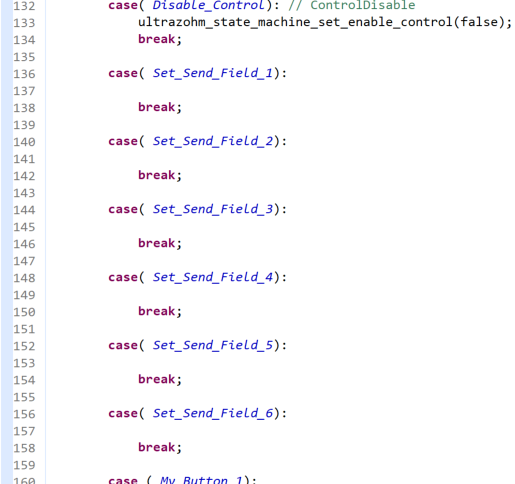
Fig. 81 Part of
ipc_ARM.cwheresend_field_xvalues are received#The
mybuttonsBesides the
send_fieldvalues, there are eight buttons available for the user. Inipc_ARM.c, one can choose what happens when pressing the buttons.Below each button is a status indicator that can be triggered also in
ipc_ARM.cif one likes to have feedback for the button actions. See/* Bit 4 - My_Button_1 */in the right picture below for example usage.
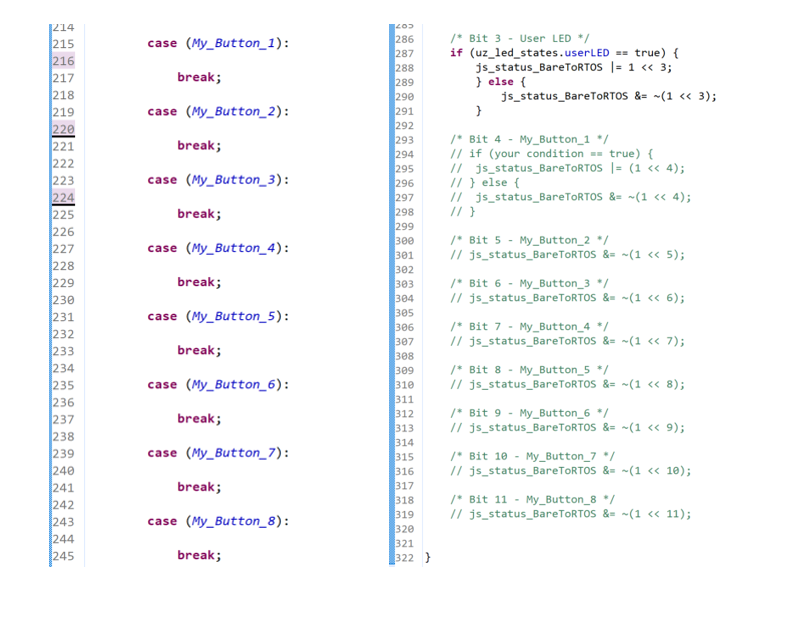
Fig. 82 left: further usage of the buttons, right: control of the status indicators of the buttons#
The
Error Resetcan be used to reset errors that occurred.What happens when pressing
Error Resetcan also be programmed inipc_ARM.cFor sending error codes to the GUI that are then displayed in the respective text field
error code, use the slow data variableJSSD_FLOAT_Error_Code.
In the
SlowDatatable it is possible to debug an almost endless number of values by receiving data from the ISR (R5 processor). However, these variables share one frame and are transferred in a chain. The more values are displayed, the longer it takes until they are updated. For changing the entries in the slow data table, see JavaScope Customization.
Warning
Error detection and handling have to be implemented by the user. The GUI just provides an interface.
Logging panel#
The logging panel is used to set up the data logger of the GUI.
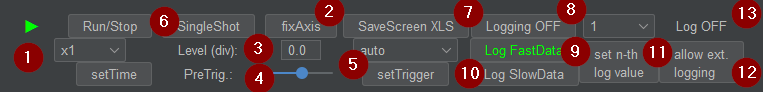
Fig. 83 logging panel#
The
setTimebutton sets the time base of the scope. It simply scales the time base of the scope by the selected value.After zooming in on one or both axes, the
fixAxisbutton reverts the axis limits to the default value.Here, the trigger level for a manual trigger can be set (e.g., 1V).
With this slider, the
preTriggercan be configured (e.g., how much time is visible before the trigger event happens).The button
setTriggersets the selection for rising or falling edge for CH1->Ch4. Choose the desired setting in the dropdown menu above.The button
SingleShottriggers the scope once.The button
SaveScreen XLSsaves the visible scope content in an XLS file.The button
Logging OFFrespectivelyLogging ONtoggles the data logger. If the button readsLogging OFF, pressing it will turn on the logger. If the button readsLogging ONand is highlighted green, pressing the button again will turn off the logger.The button
Log FastDataenables or disables the logging of the fast data (the selection in the Setup Scope page panel). If the selection is enabled, the text of the button is highlighted green. If the logging is active, this button is deactivated.The button
Log SlowDataenables or disables the logging of the slow data. The slow data values, which are logged, are the values displayed in the 20receive fields. However, to reduce the file size, only values not equal toJSSD_FLOAT_ZEROVALUEare logged. For customizing them see JavaScope Customization. If the selection is enabled, the text of the button is highlighted green. If the logging is active, this button is deactivated.With the
set n-th log valuebutton, the logging rate can be configured. Only thex-thvalue will then be logged (e.g., Factor10, only the values for every 10th timestamp will be logged). This logging rate counts for the fast and slow data. Choose the desired value from the dropdown menu above.The button
allow ext. loggingenables the start and stop of the logging via a status-bit of the R5. If this functionality is enabled, the text of the button is highlighted and the buttonLogging ON/OFFis disabled/overwritten. To activate this status bit, comment in the status-bit 12 in theipc_ARM.cfile and replace the variable for the condition with your own.Listing 53 Status bit inipc_ARM.cto transmit the external data logger signal from the R5 to the GUI. Has to be commented in#1 /* Bit 12 - trigger ext. logging */ 2 // if (your condition == true) { 3 // js_status_BareToRTOS |= (1 << 12); 4 // } else { 5 // js_status_BareToRTOS &= ~(1 << 12); 6 // }
Status indicator to display if the logging is active. It is highlighted green and displays
Log ONif either the logging through the GUI-button press or via the external signal is active. If no logging is active, the text statesLog OFF.
Customizing#
The customization workflow for the legacy GUI and the current GUI is documented in JavaScope Customization.
This includes properties.ini settings, adding scope and slow-data variables, and configuring labels and receive fields in javascope.h.
Known issues#
Warning
If the legacy GUI is distorted or the font is not readable, verify the Java installation as described in Installation.
Designed by#
Philipp Loehdefink (THN), Sebastian Wendel (THN), Eyke Liegmann (TUM), Michael Hoerner (THN), Dennis Hufnagel (THN) in 04/2022