uz_dataviewer#
uz_dataviewer is a tool to inspect log files from measurements conduced using the UltraZohm.
Specifically, the Log_*.csv logs generated by the JavaScope can be read.
Additionally, JavaScope logs that are converted to .parquet can be loaded, which is recommended for large logs.
uz_dataviewer is based on ImGUI bundle (Python API), which in turn uses ImGui/ImPlot.
uz_dataviewer is available as a desktop and (local) web application.
Detailed guidelines for building are given in Build.
Features#
Load JavaScope
.csv(delimiter;or,is auto-detected) and.parquetlog filesSubplot grid, drag-and-drop signals, adjust layout at runtime, multiple plot types (line/scatter/stairs/XY), linked X axes, secondary Y axis, cursors, spy zoom inset, show samples, per-cell
.csvexportRange-aware downsampling — multi-GB logs pan smoothly and zooming reveals detail
FFT & Histogram, optional locked time window to time plot, optional logarithmic axes,
.csvexport of FFT and histogram dataNodes for applying transforms (FFT / math / filter / shift) to signals where the result becomes a new signal. Nodes can be extended with custom Python code for user-specific nodes (Node plugins)
Command console and script support: every action in the GUI is a command. Save sessions save to JSON or a
.uzscript.
Starting uz_dataviewer#
The uz_dataviewer is located in ultrazohm_sw/dataviewer/ and there are multiple options to run the application.
The uz_dataviewer is available as a local web version, a native application using the compiled binary, or as a native application running directly from source.
See Build for instructions on how to build the binary.
Starting uz_dataviewer from the binary, assuming the binary is located in ultrazohm_sw/dataviewer/dist.
The application can be run in an arbitrary location.
When the binary is not located in ultrazohm_sw/dataviewer/dist, see Node plugins.
./uz_dataviewer/dist/uz_dataviewer # from ultrazohm_sw/
Starting uz_dataviewer from source, using venv is recommended, but not required if the required dependencies are installed.
Note that uz_dataviewer can only run in headless mode in the VS Code Remote Container.
Thus the following commands need to be run on the local machine, not in the container, to see the GUI.
cd uz_dataviewer                     # from ultrazohm_sw/
python -m venv venv
source venv/bin/activate             # Linux/macOS
.\venv\Scripts\activate              # Windows
pip install -r requirements.txt
python run.py                        # or: python -m uz_dataviewer
python run.py ../javascope/Log_2026-06-11_22-45-16.csv   # preload
python run.py session.uzscript       # replay a saved session
Starting uz_dataviewer from the binary, assuming the binary is located in ultrazohm_sw/dataviewer/dist.
cd uz_dataviewer/
(cd web && python -m http.server 8000)
Open http://localhost:8000/ in a web browser to start the web version of uz_dataviewer.
Quickstart#
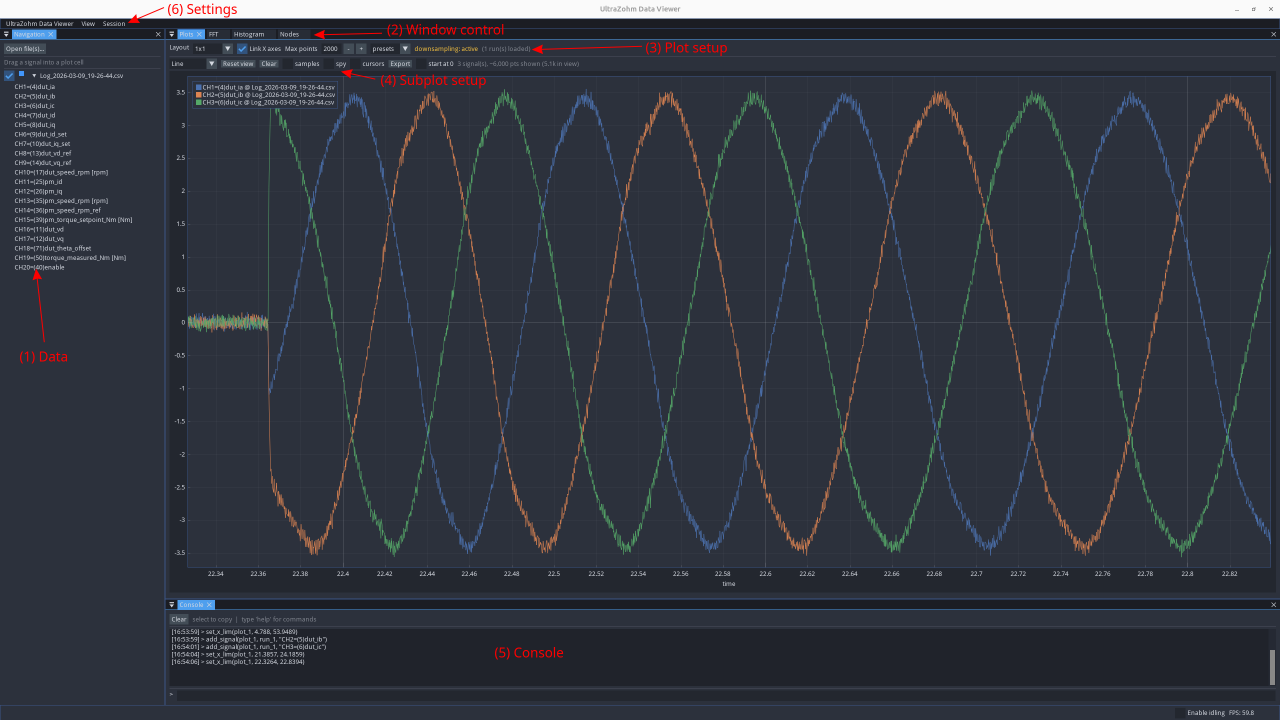
Fig. 93 Layout of uz_dataviewer.#
Fig. 93 shows the Layout of uz_dataviewer with data navigation (1), window control (2), plot setup (3), subplot setup (4), console (5), and settings (6).
The data navigation is used to open log files.
Log files can be opened by clicking the Open file(s)… button or by dragging and dropping files onto the navigation panel (native only).
Individual signals of a log can be dragged and dropped into the plot area.
Right click on the log shows information and gives access to additional per-log settings, such as time normalization.
The window control (2) offers settings for the complete window, e.g., the plot, histogram, FFT, or nodes window.
Windows can be closed, floated, docked as tabs and are resizable.
The window control (2) for the plot window gives access to, for example, the plot layout such as 1x1 or 2x1.
Settings of the window control (2) are global for the complete window.
The subplot setup (4) controls individual subplots and gives access to settings such as the plot type (line, scatter, stairs, XY), or secondary y-axis.
The console (5) shows the command log and allows to enter commands, which are also logged.
The settings (6) give access to application settings, such import and export of current application state (session) and settings the view (view), e.g., reset to default view.
For all plots, the following interactions are available: Mouse wheel zooms in and out, right-click and drag creates a zoom rectangle, right-click while holding shift only zooms the x-axis, while holding Alt only zooms the y-axis. Right-clicking the x-axis or y-axis gives access to additional settings.