Performance Test Results#
DC Analysis#
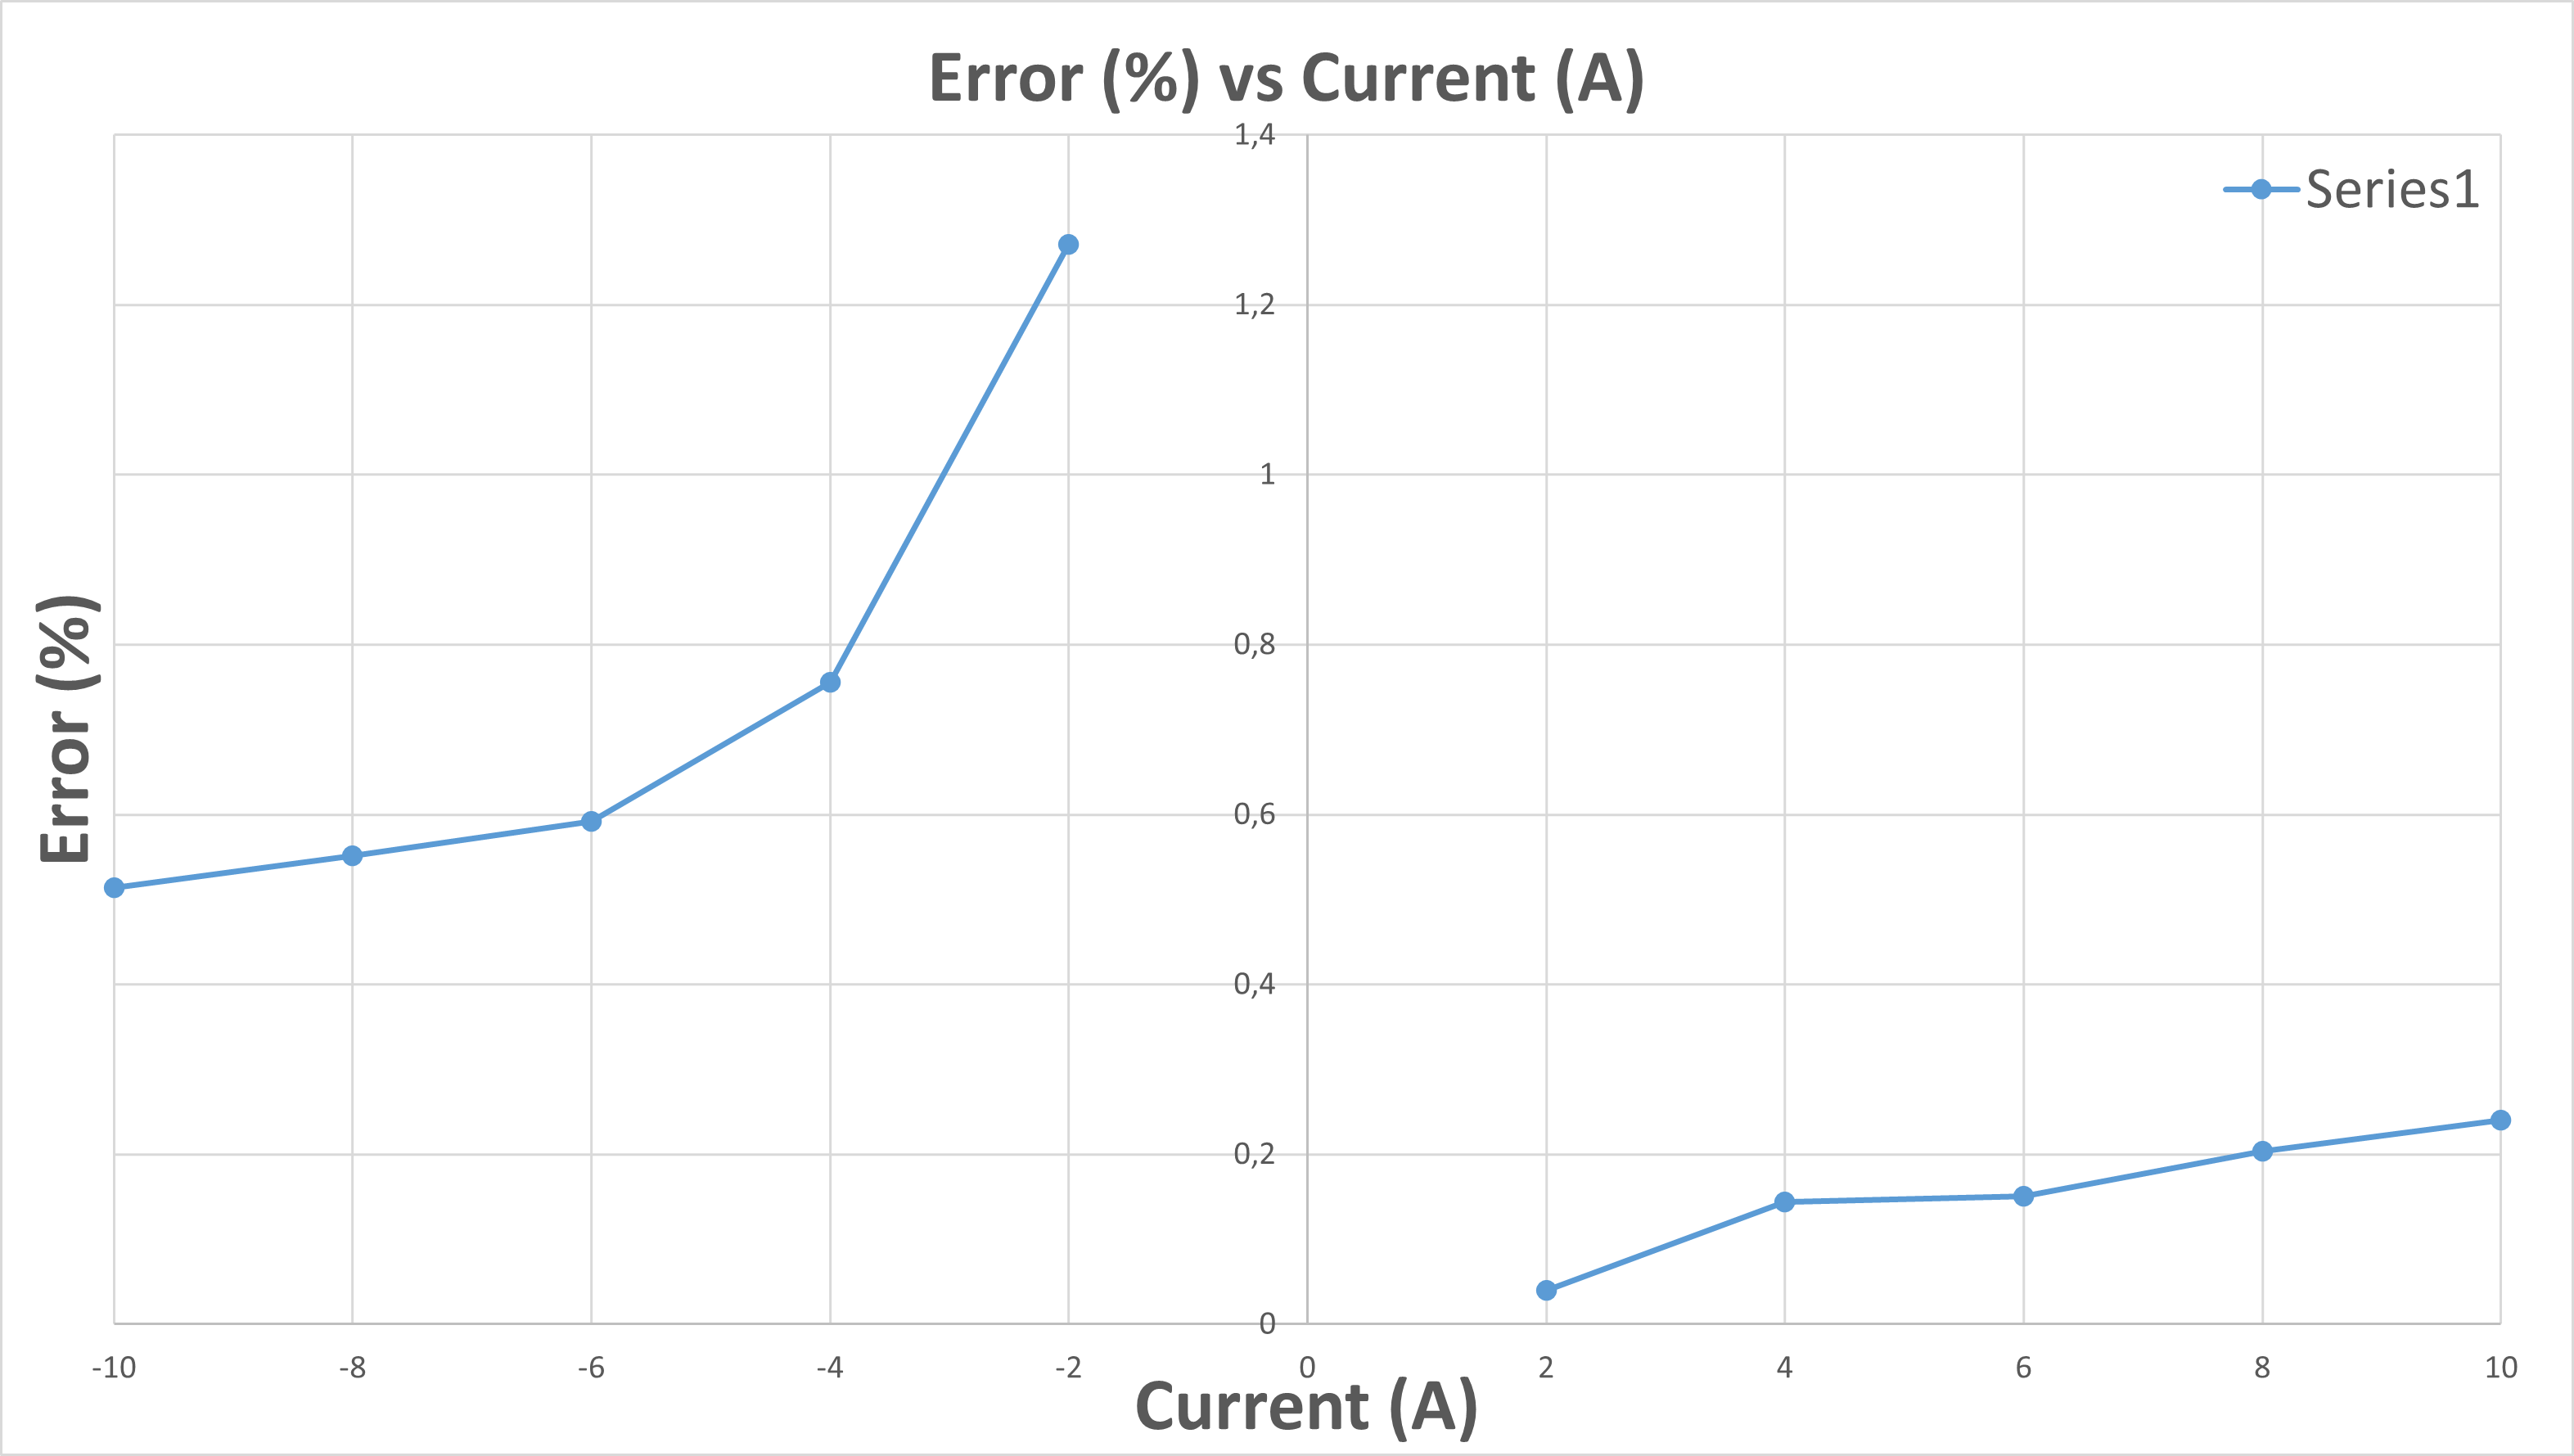
The following figure shows the percentage error between the expected and measured differential output voltage over a DC input current range of -10 A to +10 A using the CASR 6-NP sensor.
At positive currents the error remains below 0.3%, while at negative currents, the error increases slightly, peaking at -2 A, reaching approximately 1.3%, and then decreases toward ~0.5% at -10 A.
This asymmetry is likely due to slight sensor nonlinearity or residual offset in the amplifier or measurement system.
DC Performance Conclusion#
The sensor demonstrates a good accuracy, with the total error falling below 1.3% across the full ±10 A range.
AC Analysis - Time and Frequency Domain#
Time and Frequency Domain Analysis#
To evaluate the ripple characteristics and internal modulation effects of different sensor technologies, a test was conducted using equally rated sensors: the LEM CASR25-NP and the Sensitec CAS5025SRA-LI. A 500 Hz, 1 Arms sinusoidal current was applied, and the sensor outputs were captured using both single-ended (TPP0101 Tektronix Oscilloscope Probe 100Mhz) and Micsig MOIP350P OP200-3 differential probes.
Red trace: LEM CASR25-NP output (single-ended)
Black trace: Sensitec CAS5025SRA-LI output (single-ended)
Green trace: Same Sensitec CAS5025SRA-LI output measured using the differential probe, connected at the RJ45 output. This also includes the effect of the populated differential filter capacitor (C18 = 5.6 nF), while the common-mode capacitors (C16, C20) remain unpopulated.
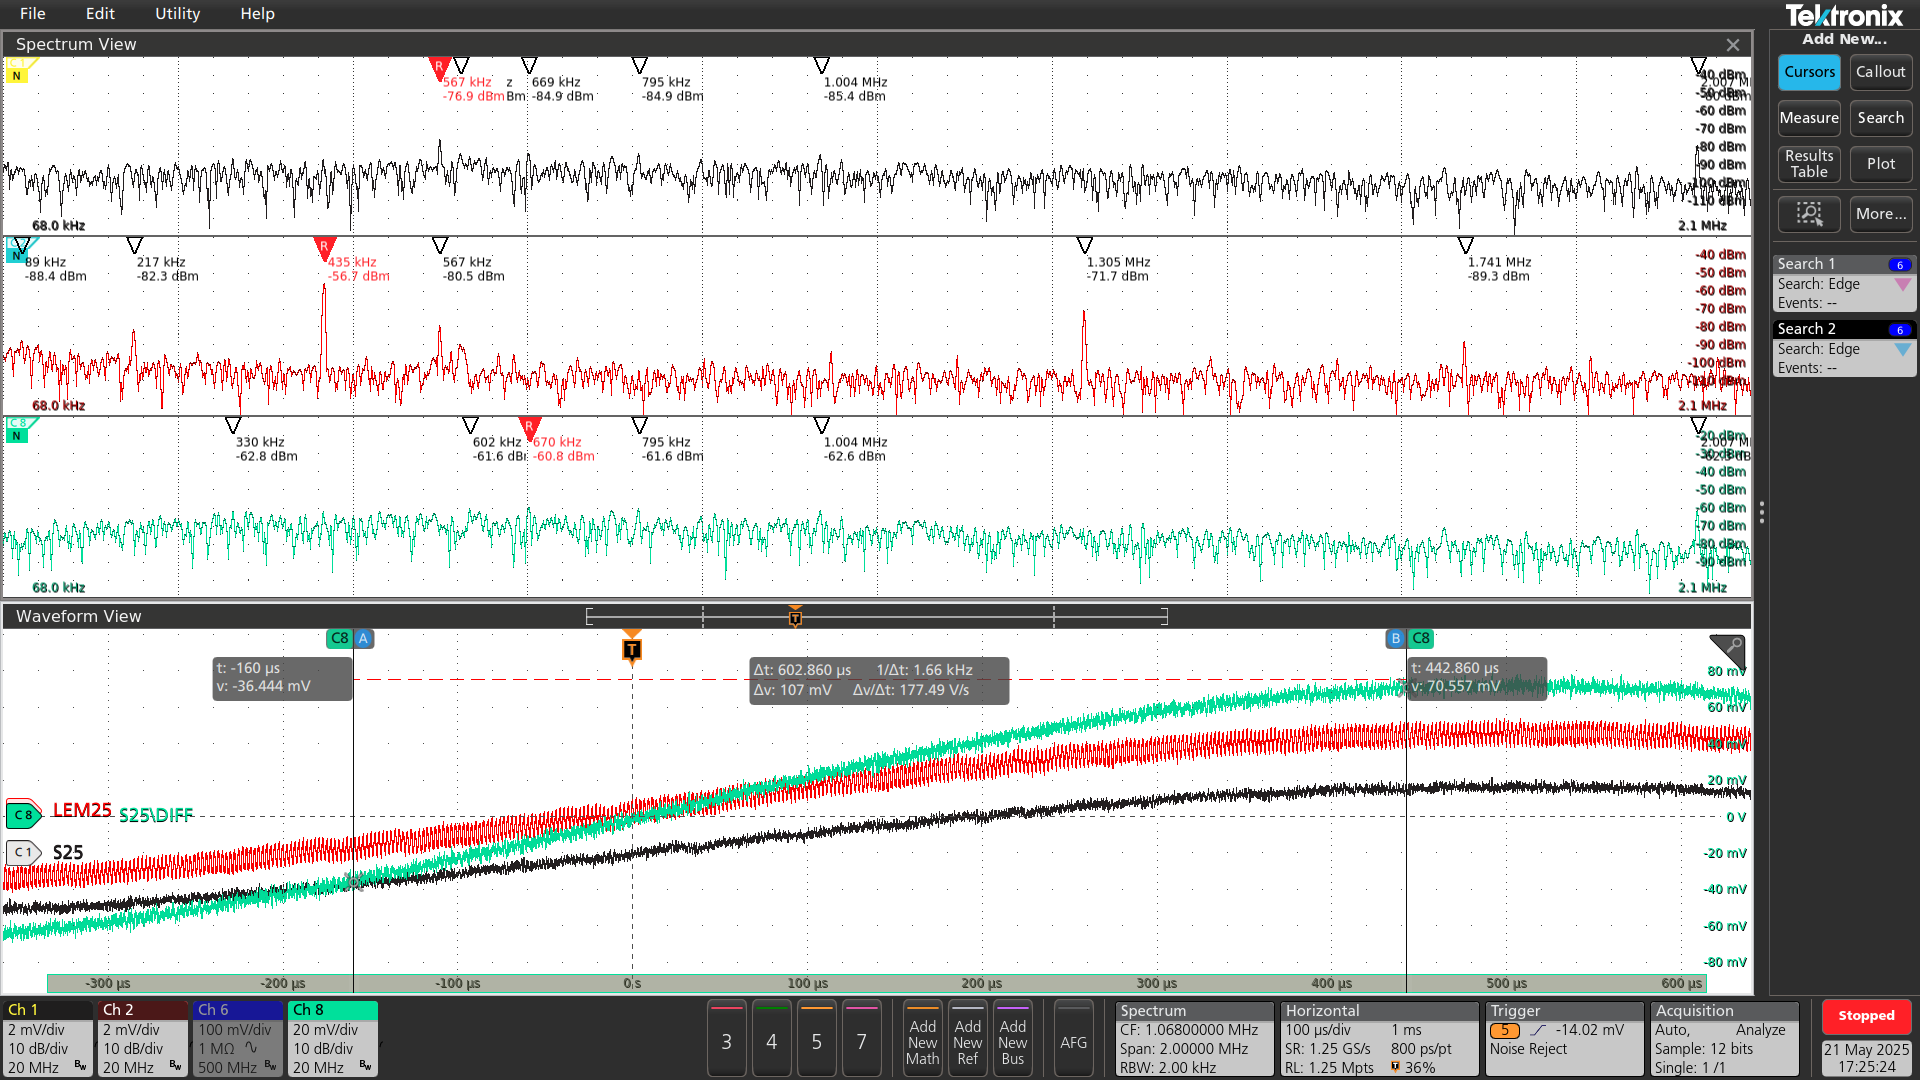
Fig. 293 Comparison of CASR (LEM) and CAS5025 (Sensitec) outputs in time and frequency domains.#
The frequency-domain FFT (top panel) reveals differences between the LEM CASR and Sensitec TMR sensors:
The LEM CASR (red) output shows a modulation peak around 435 kHz along with odd-order harmonics. This matches the internal fluxgate excitation frequency documented in the CASR datasheet (see figure below), confirming the presence of periodic ripple due to internal modulation. These harmonics translate into visible ripple in the time-domain waveform (red trace, bottom panel).
By contrast, the Sensitec CAS5025 TMR sensor shows a flatter frequency spectrum in the same FFT panel, with no excitation-related harmonics. Its time-domain output is smoother and less noisy, under identical test conditions.
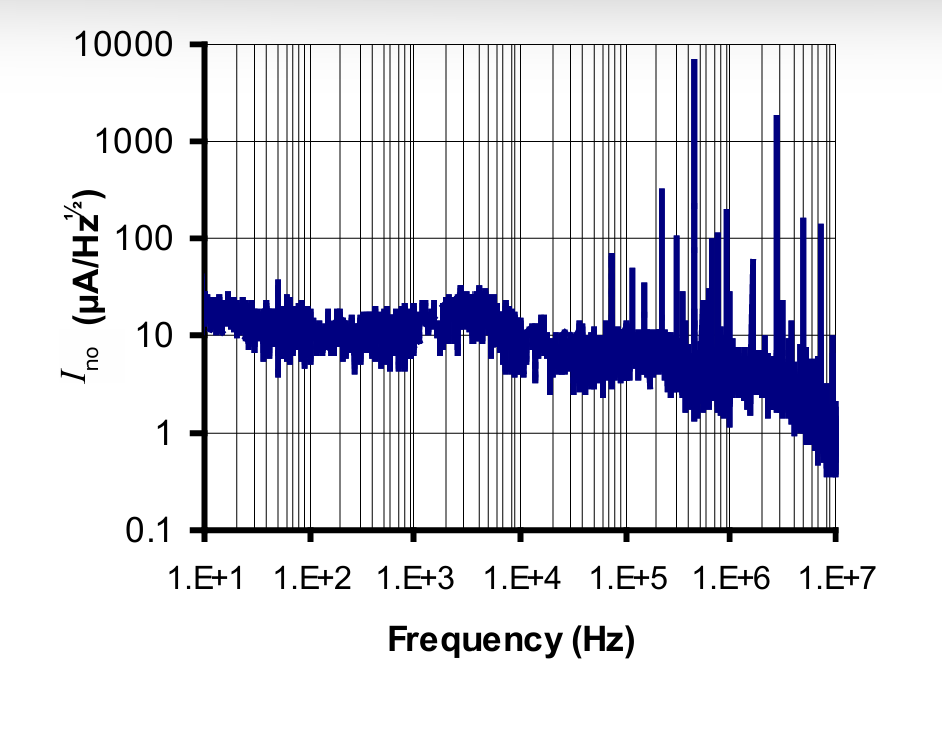
Fig. 294 Input noise spectrum of LEM CASR sensor (from datasheet). Strong excitation harmonic appears at ~435 kHz with visible odd harmonics.#
Note
The time-domain ripple is caused by spectral components shown in the FFT. In fluxgate sensors, these originate from internal excitation at ~435 kHz. By contrast, TMR sensors do not use modulated excitation and thus show less periodic ripple.
Its shown that the internal excitation frequency of fluxgate sensors introduces strong harmonic components into the output signal. While these harmonics can be attenuated with an analog low-pass filter, such early filtering limits the measurement bandwidth because it the must attenuate frequencies below or around 435 kHz to suppress the internal ripple.
As a result, the sensor’s output bandwidth becomes restricted. To overcome this limitation, advanced digital filtering techniques such as oversampling, digital filtering, and notch filters implemented in the FPGA can be used. They can allow variable attenuation of the harmonics, without compromising the full analog bandwidth. This would enable more accurate high-frequency signal acquisition while still suppressing and rejecting modulation related harmonic peaks.
FFT Comparison Between CAS5025 and CAS5015#
A follow-up test was performed to compare the spectral behavior of the Sensitec CAS5025SRA-LI and CAS5015SRA-LI under identical conditions (500 Hz, 1 Arms sinusoidal current) with Micsig MOIP350P OP200-3 differential probes on Ethernet adapter.
The 25 A variant showed a distinct narrowband spike at ~2 MHz in the FFT spectrum (see earlier figure), while the 15 A variant exhibited a flat frequency spectrum with no such harmonic content at ~2 Mhz, as shown below:
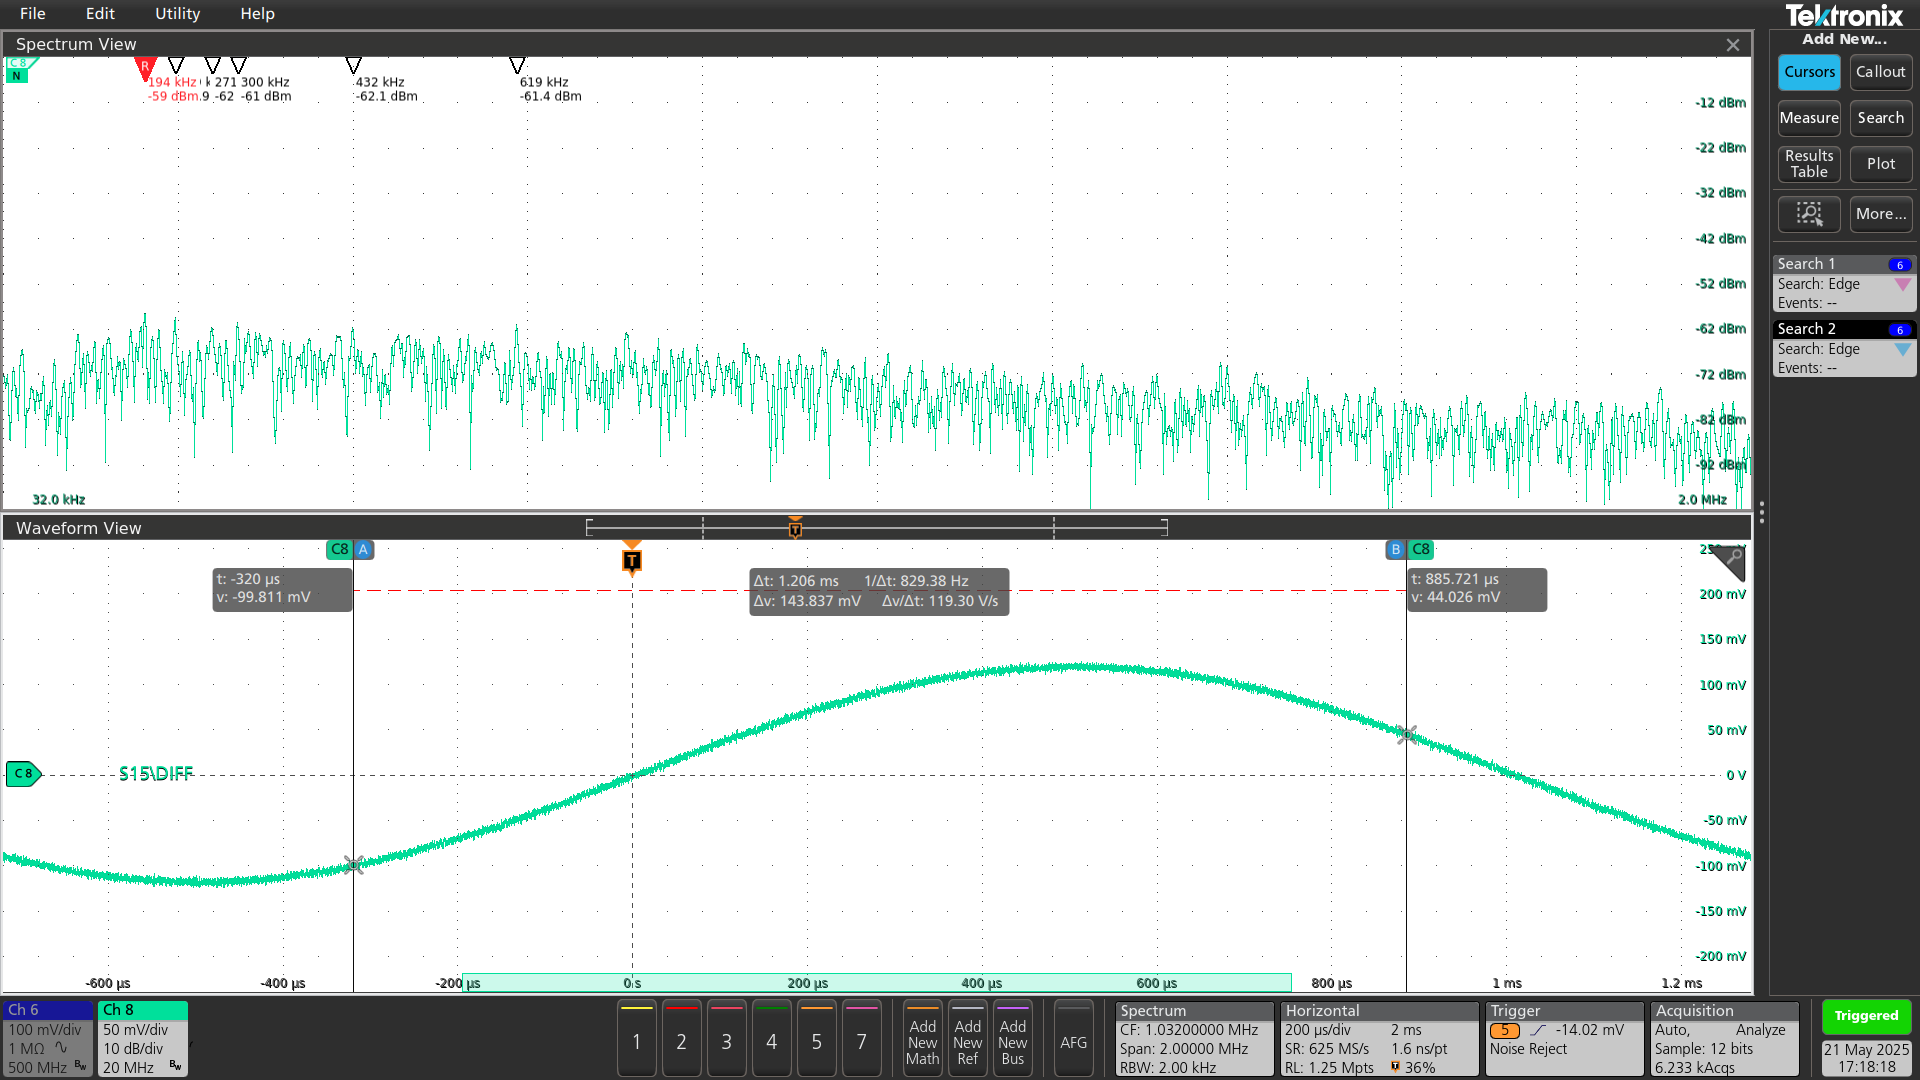
Fig. 295 FFT and time-domain waveform of the CAS5015SRA-LI sensor. No spectral peak is present at 2 MHz, unlike in the CAS5025SRA-LI.#
This suggests the 2 MHz spike in CAS5025 originates from internal circuitry specific to the 25 A variant and is not present in the 15 A model.
AC Analysis - Impedance Measurement#
This section presents comparative impedance measurements using various sensors under consistent conditions, performed using the Bode 100 setup with the APS 1000 current amplifier.
Note
As discussed previously, the Spitzenberger APS 1000 has a large-signal bandwidth of approximately 30-50 kHz. Therefore, all impedance interpretations in this section are limited to frequencies up to 50 kHz, where the current injection remains reliable and linear. Roll-off behavior above this range may reflect limitations in the current amplifier rather than sensor characteristics.
Test 1: Sensitec CAS5015SRA-LI Behavoiur#
This test evaluates the impedance response of the CAS5015SRA-LI sensor under varying AC excitation and DC offset:
Black trace: 0 A DC offset, 0 dBm AC amplitude (≈ 1.67 A_peak)
Green trace: 2 A DC offset, 0 dBm AC amplitude (≈ 1.67 A_peak)
Red trace: 0 A DC offset, 12 dBm AC amplitude (≈ 5.30 A_peak)
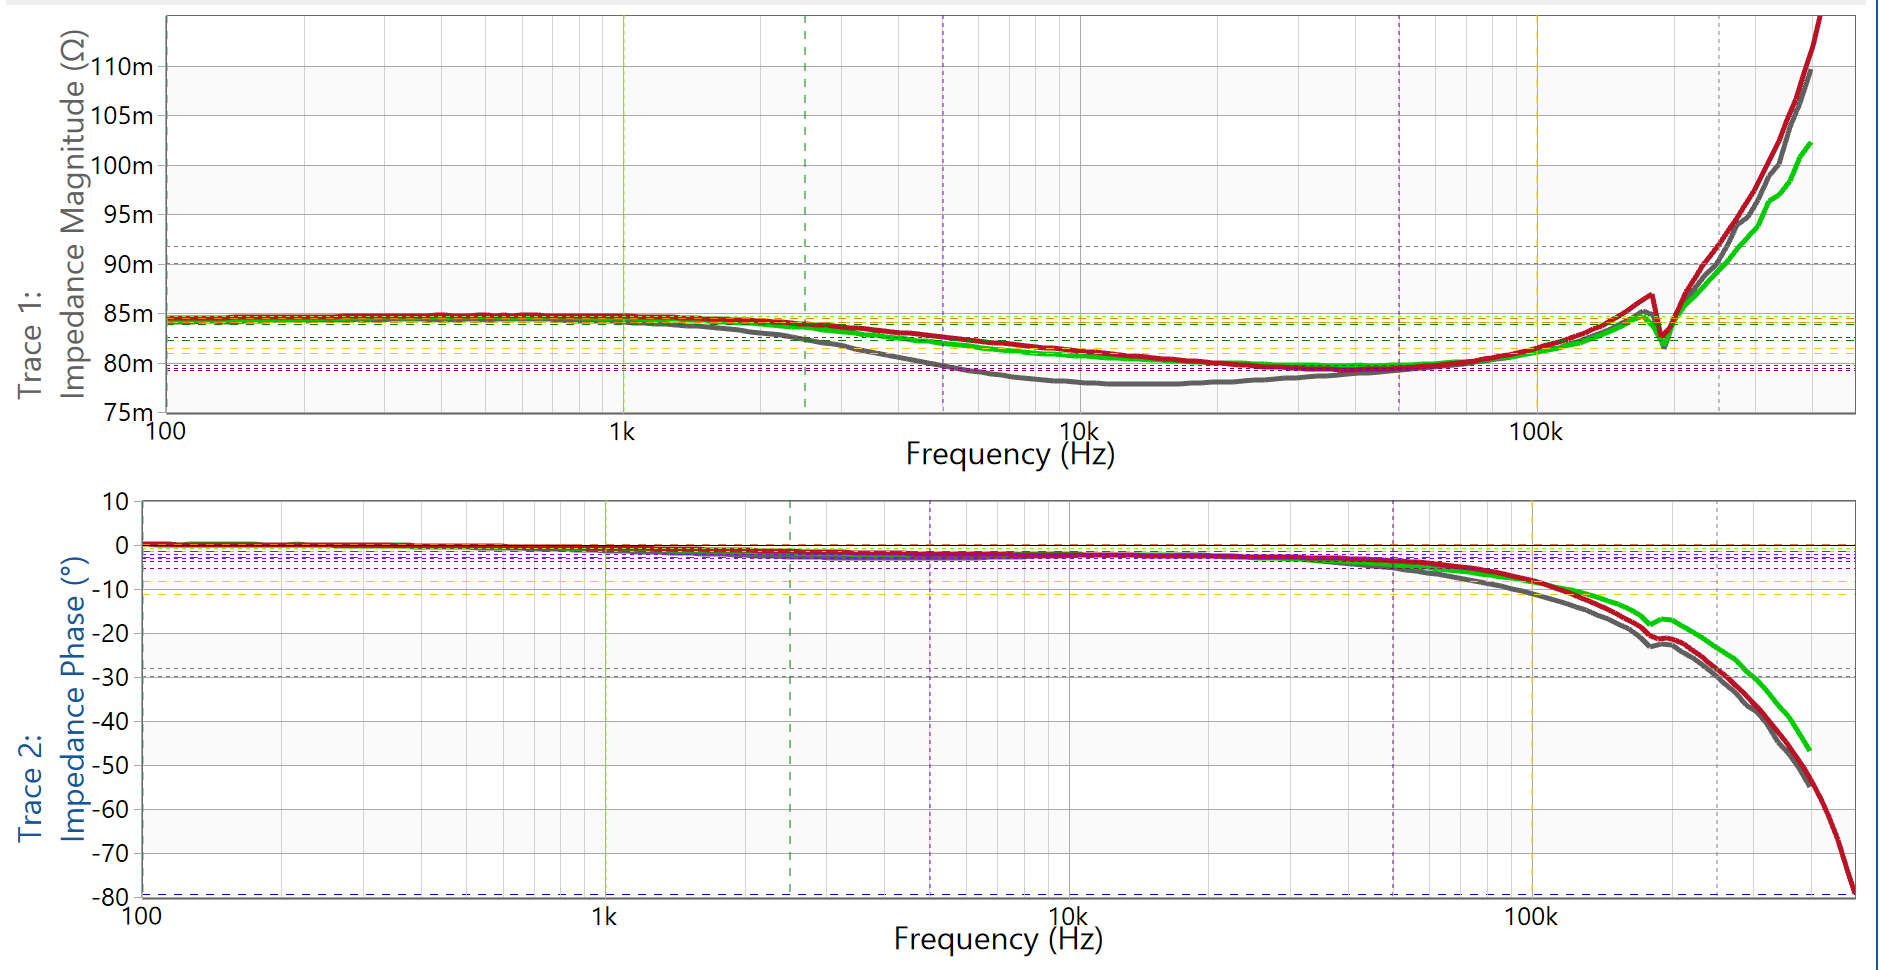
Observations:
All traces follow a similar phase trend. Impedance magnitude is stable across all conditions in the sub-2 kHz range. These align with expected impedance values calculated as:
\[Z_{\text{expected}} = \text{OpAmp Gain} \times \text{Sensor Sensitivity} = 2 \times 41.667\, \mathrm{\frac{mV}{A}} = 83.334\, \mathrm{m\Omega}\]
The slight dip observed near 2 kHz is most pronounced in the 0 dBm / 0 A case (black trace). This excitation current corresponds to the furthest below the sensor’s nominal rating.
According to correspondence with Sensitec engineers, each sensor is optimized for its nominal current range (in this case, 15 Arms). When operating at the lower edge of the sensor’s range, measurement accuracy decreases. In this region, the signal is more susceptible to internal nonlinearities, noise, and crossover effects near 0 A. This explains the greater deviations observed in low-amplitude tests compared to measurements taken closer to the nominal current.
Moreover, the observed dip in the frequency-domain response of Sensitec sensors is related to their internal operating mode. Specifically, the sensor transitions from a closed-loop, field-sensor-controlled mode to a more transformer-like behavior at higher frequencies. While the winding ratio remains unchanged, this transition region introduces a measurable dip in gain, which the engineer referred to as a kind of “turbo lag” effect.
Test 2: Cross-Sensor Comparison#
In this test, two different low-current-rated sensors are compared under identical conditions: 0 dBm AC amplitude (≈ 1.67 A_peak) with 0 A DC offset.
The goal of this test is to directly compare sensors with similar nominal current ratings from two different manufacturers and distinct sensing technologies (TMR vs. Fluxgate). While the underlying sensing elements differ, both sensors operate in a closed-loop (compensated) configuration. This means that both use a feedback mechanism to maintain magnetic balance in the core. The primary current generates a magnetic field, which is canceled by a compensation current in the feedback loop.
STB-6CAS/F (TMR, Sensitec) - Orange trace
CASR 6-NP (Fluxgate, LEM) - Blue trace
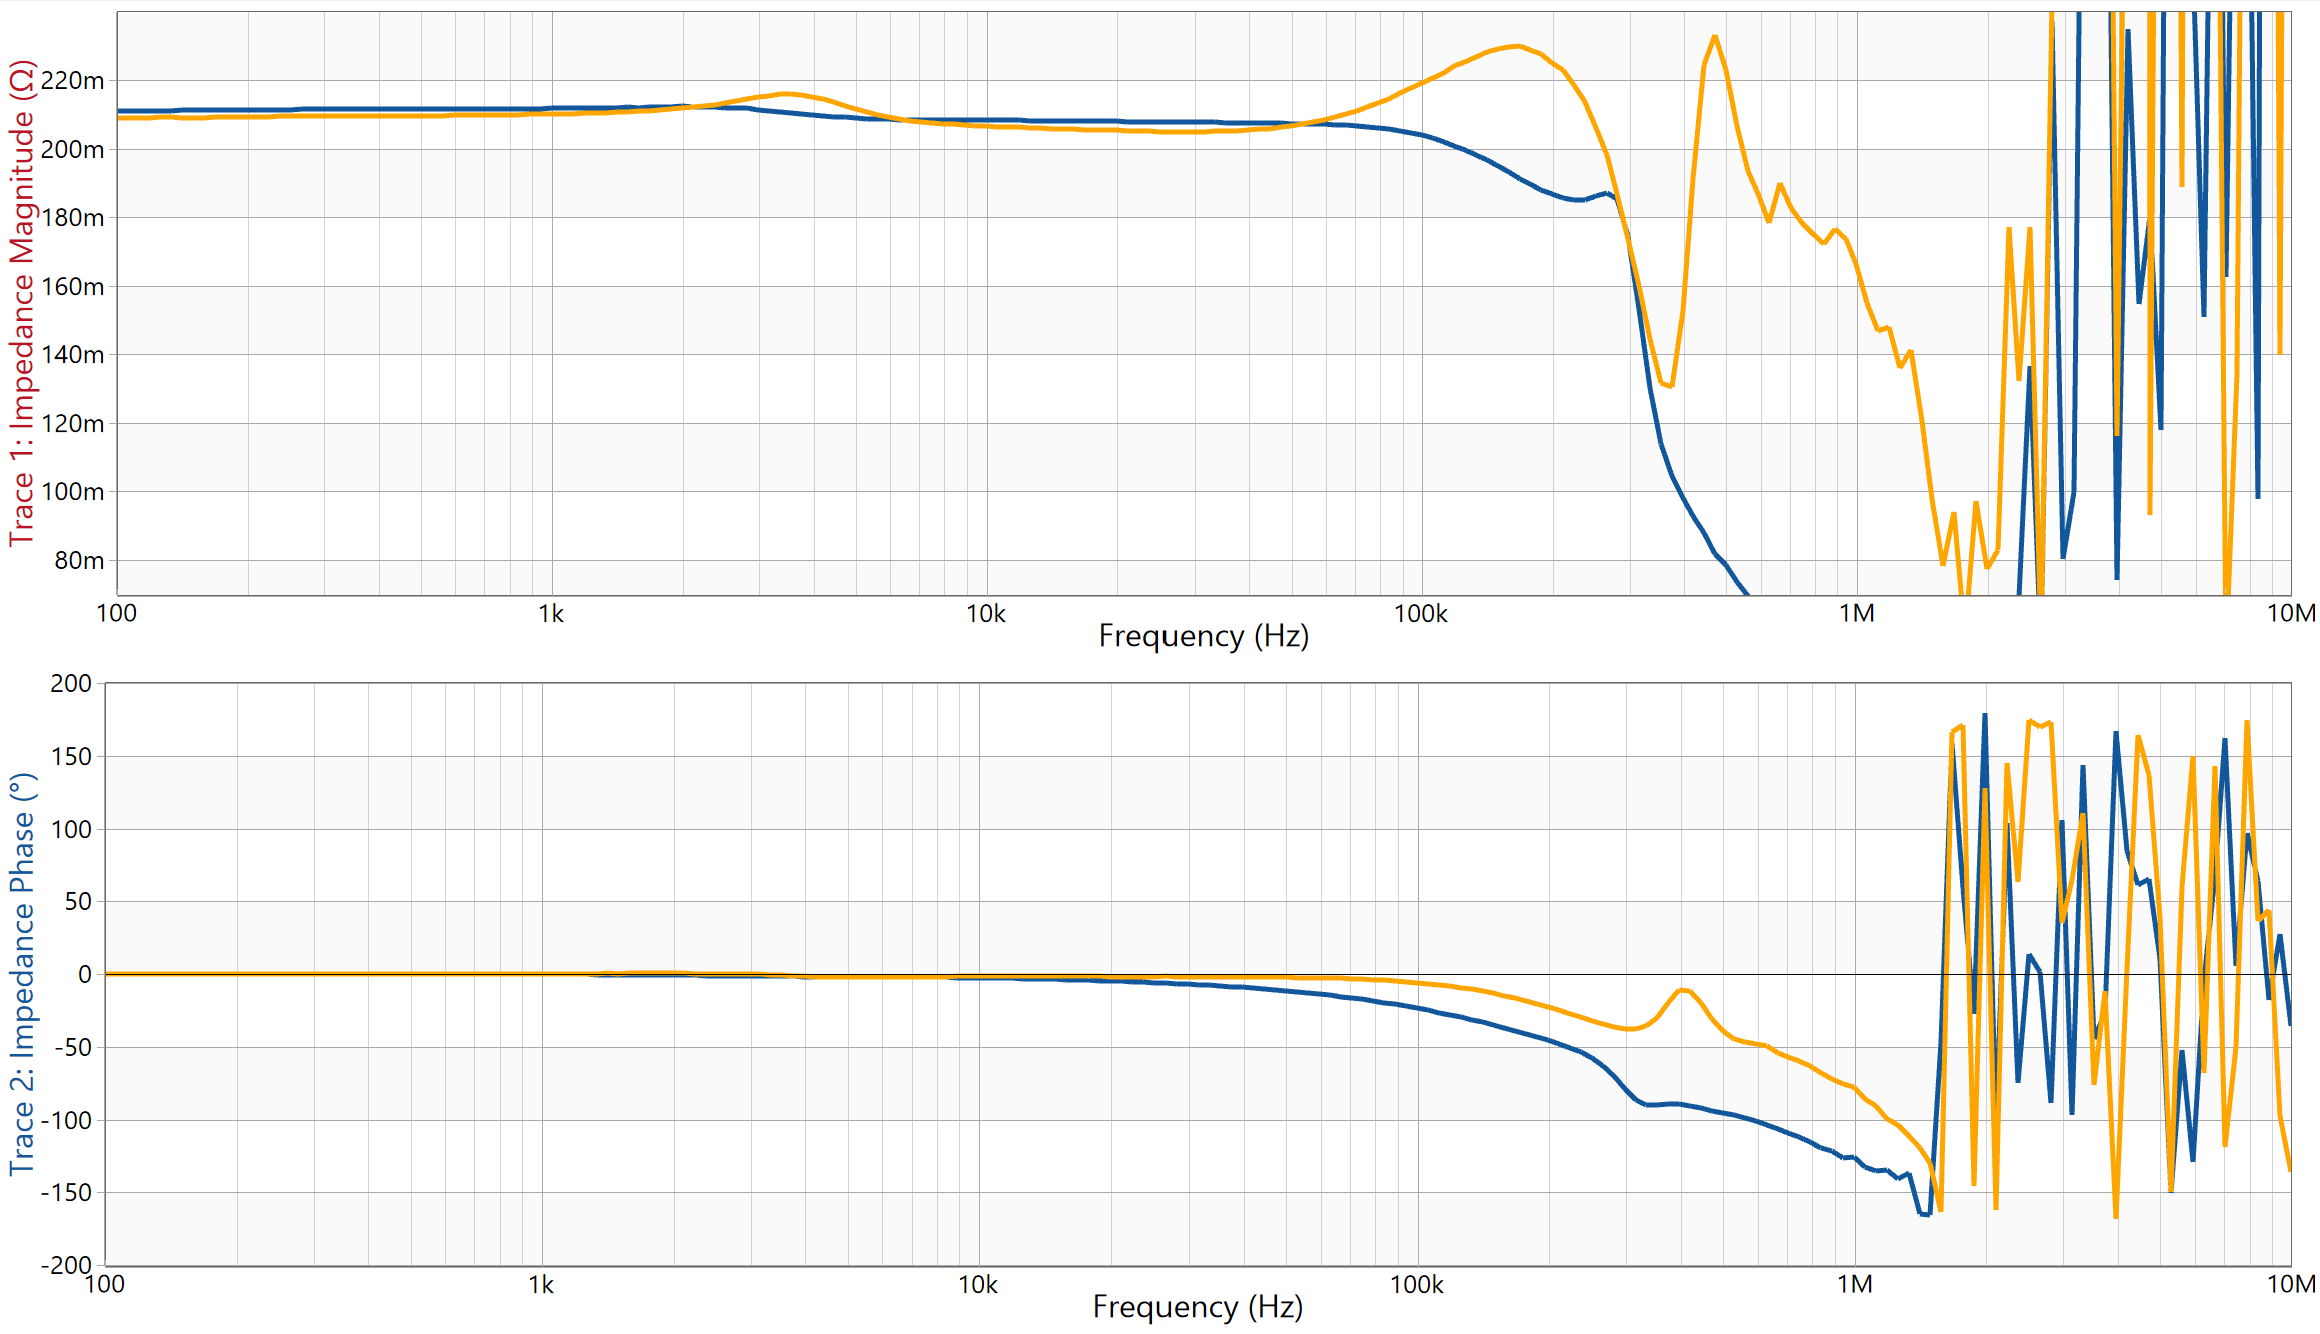
Observations:
Overall, both sensors show stable impedance behavior up to approximately 100 kHz, matching the expected impedance values (~210 mΩ).
A dip/rise in impedance magnitude is visible near 2 kHz in both sensors, similar to the previous test. This is more pronounced for TMR sensor because of the internal operating mode transition as mentioned in previous test.
The impedance magnitude of the Fluxgate sensor (blue trace) remains slightly flatter compared to the TMR sensor (orange trace).
The phase response of all sensors remains flat below 20 kHz and gradually drops approaching 50 kHz.